Nitya punches hard with his first PhD pub
Out online early in Biological Invasions, Nitya shows how you can use interviews with local people to reconstruct the invasion of a species.
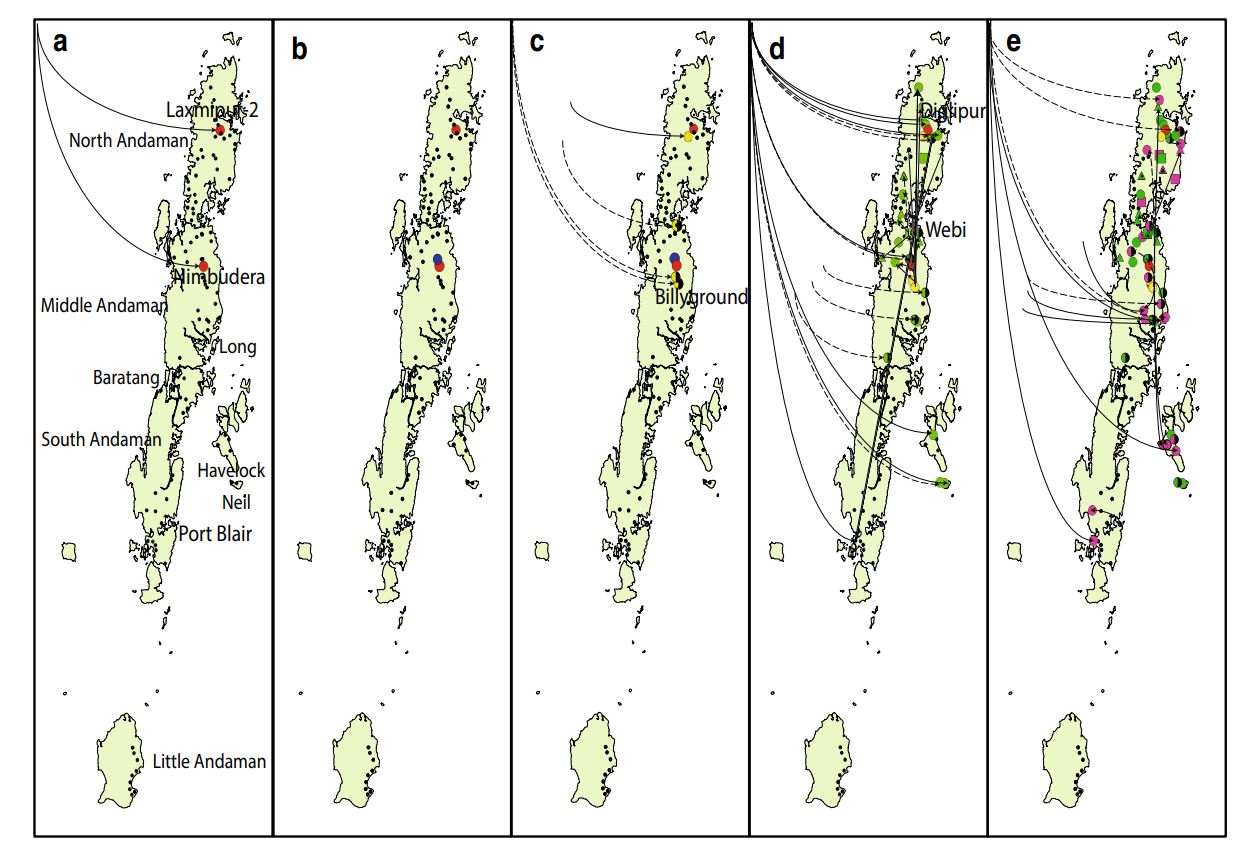
This is a great paper where Nitya went to 91 villages across the Andaman Islands to interview local people in order to discover when and where Indian Bullfrogs had invaded the islands. A quick look through these time slices below will show not only the sites of initial invasion, but also how they spread.
In the figure, each panel relates to a different time period: a 2001–2003, b 2004–2006, c 2007–2009, d 2010–2012, and e 2013–2015. Coloured symbols indicate new populations reported in each time period, with colours of each time period being fixed in the following periods. Circles denote fish culture as the most reported pathway, triangles denote release, and squares denote no response. Half-filled symbols indicate uncertainty in dispersal information (less than 50% responses). The direction of introduction and dispersal pathways is marked with arc line (fish culture) and straight line (release), where dotted lines indicate uncertainty in source.
Want to read more? Catch the paper now at Biological Invasions:
Mohanty, N.P. & Measey, J. (in press) Reconstructing biological invasions using public surveys: a new approach to retrospectively assess spatio-temporal changes in invasive spread. Biological Invasions DOI: 10.1007/s10530-018-1839-4


