Subscribe to MeaseyLab Blog by Email

Your studies and your mental health

21 March 2021

Doing a PhD is stressful and you'll need a support network

Stress is a natural part of life and many people are at their most productive when they are under pressure. This would most typically be a deadline. Although deadlines don’t work for everyone. Douglas Adams famously claimed to “...love the whooshing noise they make as they go by.” Problems arise when we become unable to fully respond. In the academic environment, pressures and expectations can elicit unpredictable survival responses as if you were surviving an attack and prompting you to fight, flight or freeze. Additional demands on your time may also push your life off balance, so that you start to neglect your personal relationships, exercise regime or even nutrition and personal hygiene. There is also the high likelihood that you will suffer feelings of inadequacy due to imposter syndrome (see here). 

Doing a PhD will be the cause of stress not only in your working life, but will also impact other areas of your life. Being aware of this at the outset will allow you to alert close members of your non-working life (think partner, family and friends) that they may well need to act as a support network. It is worth tracking your mental health during your PhD to check that you are not getting into difficulties. See part 5 to a guide on how to track your mental health.

Although there are not many studies on mental health for PhD students, those that exist (as well as surveys: Nature 2019) all suggest that there is a significant toll, which is proportionately higher than others in society (Levecque et al 2017). Whatever your prior experience of stress in a working environment, academia is known to be particularly stressful, and as a PhD student you are likely to absorb a significant amount of this stress into your own life (Strubb et al 2011). 

The General Health Questionnaire (GHQ) is a simple instrument used to measure occupational health. Because it is simple to score, you can perform it on yourself at any time during your PhD studies, and you can use your responses as an indication of whether you need to reach out to occupational or professional support networks. 

Right now, I suggest that you read through the questions in the GHQ and record your answers as a baseline. Keep the scores somewhere safe. During the course of your PhD, if you feel that your scores may have changed take the test again and compare them with your saved scores. Although there are no hard rules, if three or more of your scores have moved by two or more points then you need to discuss this with your support network and decide whether or not to seek professional help. 


General Health Questionnaire:


Have you recently... 

0

1

2

3

been feeling reasonably happy, all things considered?

Better than usual

Same as usual

Less than usual

Much less than usual

lost much sleep over worry?

Not at all

No more than usual

More than usual

Much more than usual

been feeling unhappy and depressed?

Not at all

No more than usual

More than usual

Much more than usual

felt you couldn’t overcome your difficulties?

Not at all

No more than usual

More than usual

Much more than usual

felt under constant strain?

Not at all

No more than usual

More than usual

Much more than usual

felt capable of making decisions about things?

Better than usual

Same as usual

Less than usual

Much less than usual

been able to face up to your problems?

Better than usual

Same as usual

Less than usual

Much less than usual

been thinking of yourself as a worthless person?

Not at all

No more than usual

More than usual

Much more than usual

been losing confidence in yourself?

Not at all

No more than usual

More than usual

Much more than usual

been able to enjoy your normal day-to-day activities?

Better than usual

Same as usual

Less than usual

Much less than usual

been able to concentrate on whatever you are doing?

Better than usual

Same as usual

Less than usual

Much less than usual

felt that you are playing a useful part in things?

Better than usual

Same as usual

Less than usual

Much less than usual

Even if you don’t feel that you need the support of your institution now, it is worth finding out how they can support your mental health. Although there has been some stigma attached to difficulties with mental health in the past, most institutions accept that pressures are mounting on postgraduate students and that they require support. They may well have experienced councilors for you to consult with. Importantly, you should realise that none of these symptoms is unusual and that there is a high chance that many of your colleagues are also feeling symptoms. Knowing that your problems are shared and reaching out to support networks is an excellent way to prevent them from escalating beyond your control. 

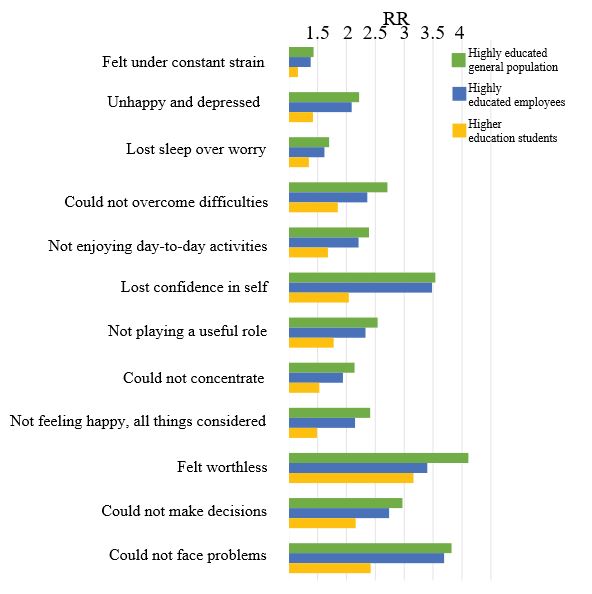
A study into the mental health of PhD students in Belgium exemplifies the kinds of difficulties that they face when compared with other similar groups (Levecque et al 2017).

A comparison of the mental health of PhD students (data from Levecque et al 2017) with highly educated general population, highly educated employees and higher education students using the General Health Questionnaire. The Risk Ratio (RR: adjusted for age and gender) in PhD students in Flanders, Belgium is consistently higher (>1) when compared to any of the other surveyed groups. 

No matter how you think of your own abilities to cope with mental health issues, doing a PhD will cause you additional stress and provoke your coping mechanisms into play. Additional stress could all be entirely beneficial, and could find yourself learning how stress affects your personality towards these positive outcomes. On the other hand, you may find that additional stress unexpectedly affects your personality, and that this will impact on both your home and working relationships. Some people will find that the additional stress will manifest itself in physical symptoms that need medical treatment. Moreover, as academia is a particularly stressful environment, you will likely take on some of this environmental stress in addition to any stress associated with your studies. Additional stressors come from home and family situations. Your best means of coping will be to have a support network in place and to understand where and with whom you can discuss any concerns. Knowing who this is and how and when to approach them will put you in a stronger position if you need them in future.

References

Levecque, K., Anseel, F., De Beuckelaer, A., Van der Heyden, J. and Gisle, L., 2017. Work organization and mental health problems in PhD students. Research Policy, 46(4), 868-879.

Stubb, J., Pyhältö, K. and Lonka, K., 2011. Balancing between inspiration and exhaustion: PhD students' experienced socio-psychological well-being. Studies in Continuing Education, 33(1), 33-50.
  Lab  Writing

Type I and Type II errors

13 March 2021

Being aware that you can get it wrong


With all the will in the world, when you are testing your hypothesis using statistics there is a chance that you will accept your alternative hypothesis when it is not valid. This is known as a ‘false positive’ or aType I error. It is also possible that you will accept your null hypothesis when you should have accepted your alternative hypothesis, also known as aType II error,or a ‘false negative’. While it won't be any fun to get a Type II error, as scientists we should be more worried about Type I errors and the way in which they occur. This is because following a positive outcome, there is more chance that the work will be published, and that others may then pursue the same line of investigation mistakenly believing that their outcome is likely to be positive. Indeed, there are then lots of ways in which researchers may inadvertently or deliberately influence their outcomes towards Type I errors. This can even become a cultural bias that then permeates the literature.

Humans have a bias towards getting positive results (Trivers 2011). If you’ve put a lot of effort towards an experiment, then when you are interpreting your result you might feel motivated towards your reasoning making you more likely to accept your initial hypothesis. This is called ‘motivated reasoning’, and is a rational explanation why so many scientists get caught up in Type I errors.  This is also known as a confirmation bias and we will discuss it in more detail elsewhere on this blog (see here). Another manifestation of this is publication bias which also tends to be biased towards positive results (see here). Put together this means that scientists being human are more vulnerable to making Type I errors than Type II errors when evaluating their hypotheses. It is important to understand that simply by chance you can make a Type I error, accepting your alternative hypothesis even when it is not correct. 

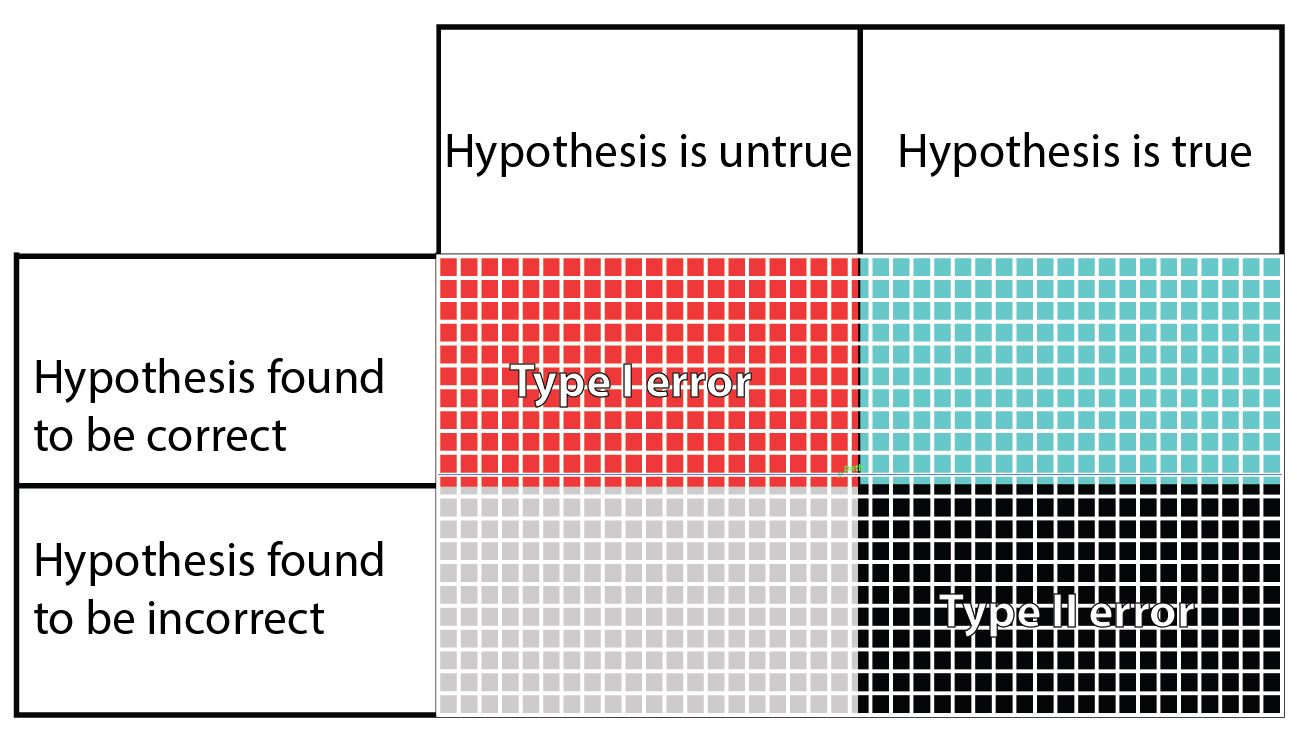
In this table, the columns refer to the truth regarding a hypothesis, even though the truth is unknown to the researcher. The rows are what the researcher finds when testing their hypothesis. The blue squares is what we are hoping to achieve when we set and test our hypothesis. The grey squares may happen if the hypothesis we set is indeed false. The other two possibilities are the false positive Type I error (red), and the false negative Type II error (black). In the table it seems that the chances of getting one of the four outcomes is equal, but in fact this is far from reality. There are several factors that can change the size of each potential outcome to testing a hypothesis.

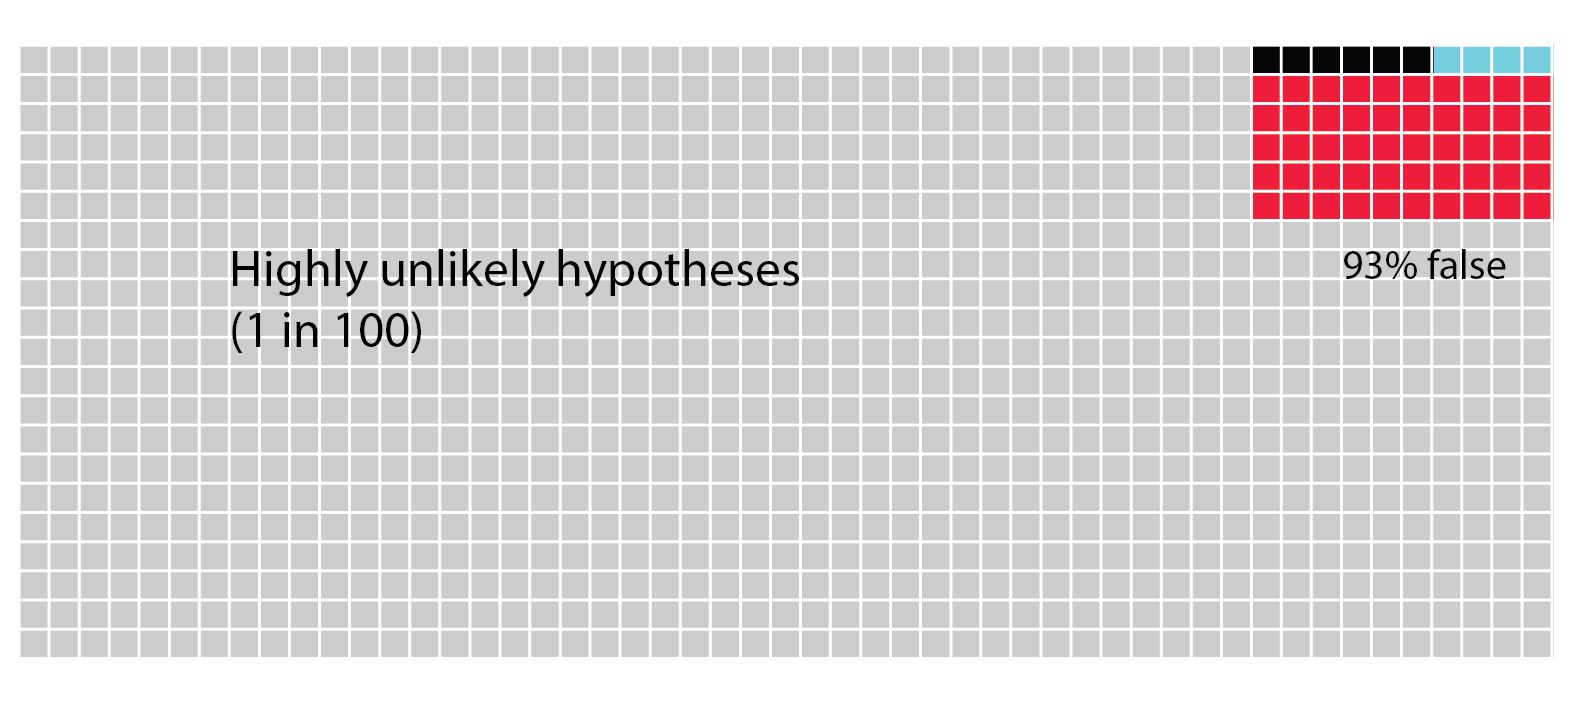
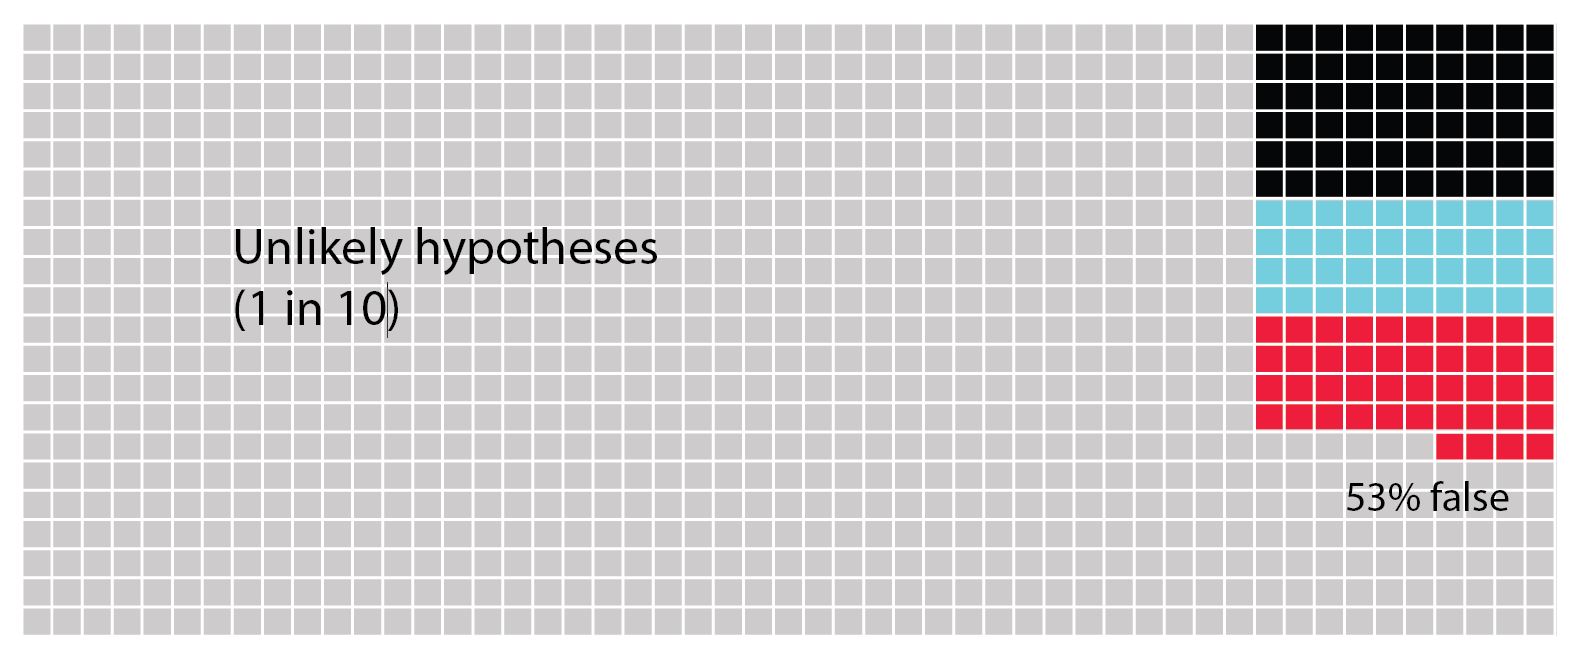
The following figure has been redrawn after figure 1 in Forstmeier et al (2017). This is a graphical representation of an argument first made by Ioannidis (2005). Each figure shows 1000 hypotheses. You could think of these as outcomes of 1000 attempts at testing the same hypothesis, or as a more global scientific effort of testing lots of hypotheses all over the world. The difference between the figures is the likelihood that the hypotheses are correct changes. In the first one we see highly unlikely hypotheses that will only be correct one in a hundred times. The blue squares denote the proportion of times in which the hypotheses are tested and found to be true. The black squares denote false negative findings, i.e a Type II error. The red squares denote false positive findings, i.e. a Type I error. Because the hypothesis is highly unlikely to be correct the majority of squares are light grey denoting that it was correctly found to be untrue. Although it might seem unlikely that anyone would test such highly unlikely hypotheses, there are increasing numbers of governments around the world that create incentives for researchers to investigate what they term blue skies research, which might be better termed high risk research or investigations into highly unlikely hypotheses. The real problem with such hypotheses is that you are more likely to get a Type I error than actually find that your hypothesis is truly correct. 

In the next figure we see a scenario of unlikely hypotheses that are found to be correct approximately one in 10 times. Now we see that the possibility of committing a Type I error is roughly equivalent to a Type II error and to the probability of finding that the hypothesis is truly correct. Thus, if your result comes out positive, you are unlikely to know why.

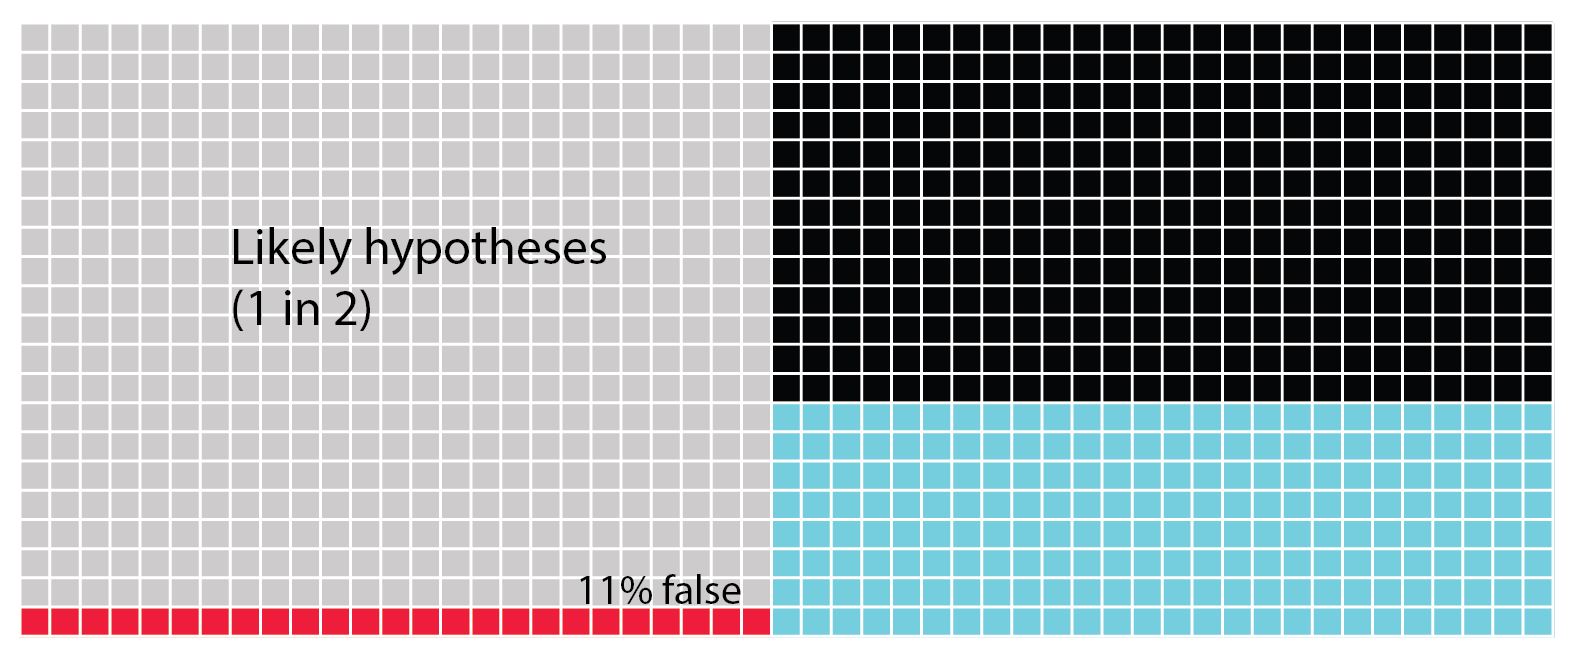
Lastly we see the scenario in which the hypotheses are quite likely to be correct one in two times. Now we can see that the possibility of creating a Type II error is highest. Next the blue squares show us the chances that we find the hypothesis is truly correct. Lastly, there's only 11% chance of a type 1 error. 

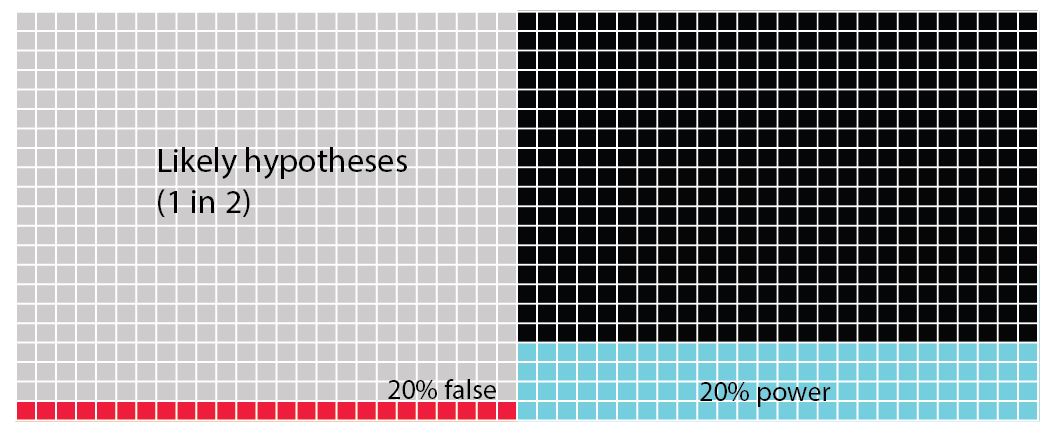
In all of these figures (above) the power of the analysis is set at 40%. The statistical power of any analysis depends on the sample size (or number of replicates) you're able to use. Some research has suggested that in most ecological and evolutionary studies this is actually more like 20% (see references in Forstmeier et al 2017). What is important to notice in the next figure (below) is that when we change the power of the analysis (in this case from 40% to 20%) we influence the proportion of Type II errors over finding that the hypothesis is correct. While the overall numbers of Type I errors does not change, if your analysis tells you to accept your alternative hypothesis, there is now a 1 in 5 chance (20%) that it will be a false positive (Type I error).

What you should see when you look at these figures is that there is quite a high chance that we don't in fact correctly assign a true positive hypothesis. There's actually much more chance that we will commit a Type II error. Worse the more unlikely a hypothesis is, we are increasingly likely to commit the dreaded Type I error.

From the outset we should try to make sure that the hypotheses you are testing in your PhD are very likely to find positive results. In reality, this means that they are then iterations of hypotheses that are built on previous work. When you choose highly unlikely hypotheses, you need to be aware that this dramatically increases your chances of making a Type I error. The best way to overcome this is to look for multiple lines of evidence in your research. Once you have the most likely hypothesis that you can produce, you need to crank up your sampling so that you increase the power of your analysis, avoiding Type II errors.


References

Forstmeier, W., Wagenmakers, E.J. and Parker, T.H., 2017. Detecting and avoiding likely false‐positive findings–a practical guide.Biological Reviews,92(4), pp.1941-1968.

Ioannidis, J.P., 2005. Why most published research findings are false.PLoS medicine,2(8), p.e124.

Trivers, R., 2011. The folly of fools New York.NY: Basic Books.

  Lab  Writing

Altitudinal transect - sea to summit

05 March 2021

Sea to summit - with frogs all the way

The African clawed frog, Xenopus laevis, is remarkable for many reasons. One of these is the distribution of these frogs in southern Africa. Not only can you find these frogs from the highlands of Malawi all the way to the most southerly point in South Africa, but you can also find them right on top of the highest mountain in Lesotho at 3200 m asl. 

The challenge for Laurie Araspin, co-tutelle student with the MeaseyLab and Anthony Herrel's FunEvol Lab at the Muséum National d'Histoire Naturelle in Paris, was to collect frogs at every 1000 m interval of altitude to determine how their physiology changes as altitude increases. 

From the sewage works in the rain at near sea-level, all the way up to the highest points of Lesotho, Laurie succeeded in finding all of her frogs. 

  Frogs  Lab  Xenopus
Creative Commons Licence
The MeaseyLab Blog is licensed under a Creative Commons Attribution 3.0 Unported License.