Subscribe to MeaseyLab Blog by Email

Portant nomination au titre d'attache honoraire

26 June 2023

Using Museum National D'Histoire Naturelle as my address

Today I learned that from 1st August 2023, I will become an Honorary Attaché of the Natural History Museum, Paris. Readers of this blog will know that I have a long association with the Muséum national d'Histoire naturelle  in Paris, dating back to the early 2000s when I worked at IRD, Bondy. Since 2006, my long term collaborator Anthony Herrel has held an associated CNRS position at the museum, and hence I've visited even more (see here).

Many of you will also know Laurie Araspin, who is registered both at the museum and at Stellenbosch University (see blog posts on Laurie here and here). 

For the next five years, I will be an attaché of the Muséum national d'Histoire naturelle, which I hope will bring more opportunities to collaborate with researchers there. Looking forward to visiting in my new role before the end of the year.


PeerJ curated articles

14 June 2023

PeerJ Expert Curations: Rapid Evolution

I was asked to curate a set of PeerJ articles around a topic, and chose to do this on Rapid Evolution. You can read the summary that I wrote and the articles I picked on this blog at PeerJ.

Curation Summary

Darwin’s (1859) theory of evolution involved ‘slow steps’ that precluded the concept of ‘sudden leaps’, instead advancing by ‘taking advantage of slight successive variations’. Although Darwin’s ideas still form the basis of our modern understanding of evolutionary processes, we now have examples of how the process can occur in the sudden leaps that Darwin himself eschewed. Documenting and investigating how these rapid evolutionary processes occur has become an important theme in 21st century life sciences. In this small selection of papers published in PeerJ Life and Environment, I highlight how scientists have gained insight on rapid evolutionary processes from multiple evidential sources, and how this has led to a better understanding of evolution today.

Rapid evolution as evidenced in PeerJ Life & Environment

Perhaps the best examples of rapid evolutionary processes are provided by the smallest living organisms. For example, Gutiérrez-Escobar et al. (2018) document how changes in genetic sequences of Helicobacter pylori sampled from patients in Columbia result in physical changes in the protein AlpA. Genetic mutations resulting in differences to transcribed proteins represent the most widely understood of evolutionary mechanisms. In their study, Gutiérrez-Escobar et al. show how the evolutionary mechanisms of gene conversion and purifying selection have diverged for this important gastric carcinogenic bacterium across a small spatial scale of Columbian cities during its short post-colonial history.

Dufour et al. (2018) use an invasion of Anolis lizards to study the evolutionary consequences on communication and behavior between native populations (A. oculatus) with and without an invasive congener (A. cristatellus). They found that in the 15 years since the introduction of A. cristatellus, populations in sympatry had decreased the proportion of display-time spent displaying (dewlapping), stressing how behavioral traits might be the first visible signs of rapid evolutionary processes taking place.

Invasive species are vulnerable to native species that may prey upon them. The ways in which these communities evolve can be surprising, especially when similar species are already present in the recipient environment. Schilthuizen et al. (2016) document how the native insect community on invasive cherries (Prunus serotina) is more diverse (but less dense) than those on native (Sorbus aucuparia) in a park in the Netherlands. Moreover, a beetle (Gonioctena quinquepunctata) collected from native and invasive trees displays different preferences in a choice test.

Regular collections of black rats (Rattus rattus) from Anacapa Island (USA) over a period of 60 years allowed Pergams et al. (2015) to make a series of detailed morphological measurements to track changes in cranial measurements. In this short period, the rats’ skulls had increased in size by between 3 and 10%, probably as a result of their island diet. Meanwhile, endemic deer mice (Peromyscus maniculatus) on the island became smaller after the introduction of the rats, likely through competition and predation.

The immune system must have the ability to respond rapidly to potential pathogens but this response is energetically expensive, and is predicted to be downregulated in invasive populations. Previous studies had shown immune response differences between populations of Rhinella marina from the core and at the invasion front in Australia. Selechnik et al. (2017) tried to replicate these results, using an experimental approach, but failed to find a difference between these two invasive populations. This reminds us that despite the overwhelming evidence for rapid evolutionary processes, we still need to proceed with caution when accepting results of previously published studies. More importantly, we need to be able to publish negative results in order for science to advance.

These exemplars also serve to demonstrate the utility of invasions to study rapid evolutionary processes in situ. While the impacts of these invasions are widely acknowledged to be largely detrimental to the recipient environment, they can serve as analogies to the impending changes to global climate due to anthropogenically mediated climate change. Why do some species thrive while others decline? Moreover, they offer scientists an opportunity to gain insight on the most fascinating and fundamental of all topics in life sciences and the environment: evolution.

  Frogs

Naas' study on fynbos frogs published!

05 June 2023

How do fish invasions change fynbos amphibian communities?


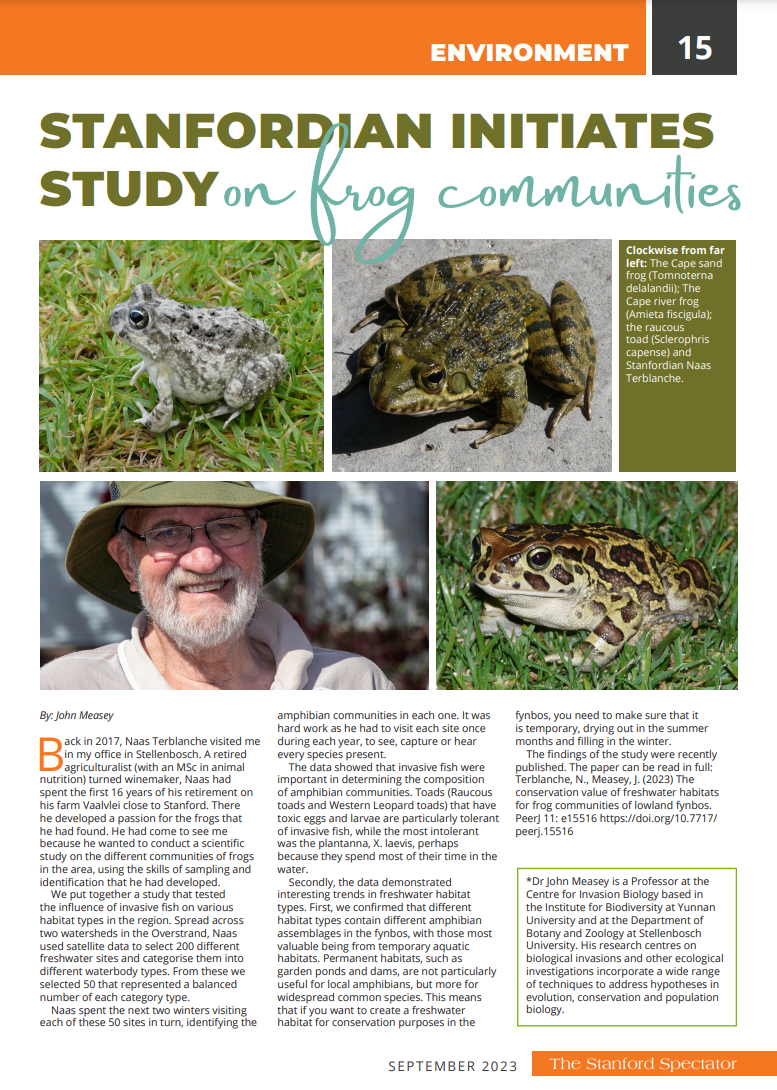
Back in 2017, Naas Terblanche visited me in my office in Stellenbosch. A retired agriculturalist (with an MSc in animal nutrition) turned winemaker, Naas had spent the first 16 years of his retirement in Stanford developing a passion for the frogs that he found there. He explained that he wanted to conduct a scientific study on the different communities of frogs that he found in the area near where he lived, using the skills of sampling and identification that he had developed.

We put together a study that tested the influence of invasive fish on various different habitat types in the region. Spread across two watersheds in the Overstrand, Naas used satellite data to select 200 different freshwater sites and categorise them into different waterbody types. From these we selected 50 that represented a balanced number of each category type.

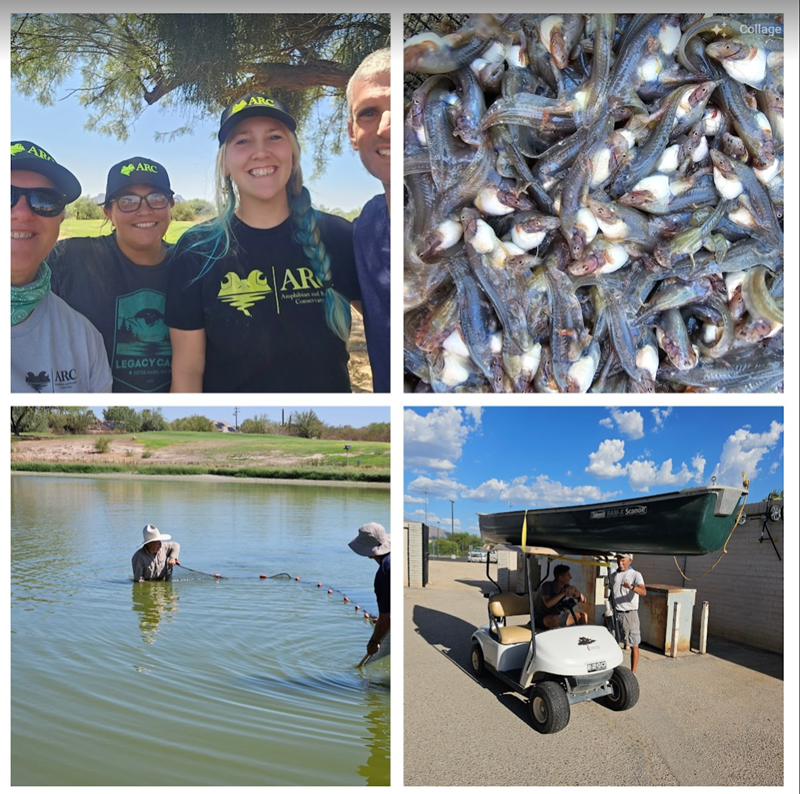
Above, Naas T shows off one of the invasive fish sampled from a dam where he also studied the amphibian community. What a great way to spend your retirement!

Naas spent the next two winters visiting each of these 50 sites in turn, identifying the amphibian communities therein. It was long and hard work as he had to visit each site once during each year, and spend the afternoon and evening conducting the surveys so that he saw, captured or heard every species present.

The data showed convincingly that invasive fish were important in determining the composition of amphibian communities. Perhaps unsurprisingly, toads (Raucous toads and Western Leopard toads) that have toxic eggs and larvae are particularly tolerant of invasive fish, while the most intolerant was the plantanna, X. laevis, perhaps because they spend most of their time in the water.

Secondly, the resulting data demonstrated some interesting trends in freshwater habitat types. First, we confirmed that different habitat types contain different amphibian assemblages in the fynbos, with those most valuable being from temporary aquatic habitats. Permanent habitats, such as garden ponds and dams, were not particularly useful for local amphibians, but more for widespread common species. This means that if you want to create a freshwater habitat for conservation purposes in the fynbos, you need to make sure that it is temporary (not permanent), drying out in the summer months and filling in the winter.

Read the paper in full:

Terblanche, N., Measey, J. (2023) The conservation value of freshwater habitats for frog communities of lowland fynbos. PeerJ 11: e15516 https://doi.org/10.7717/peerj.15516

  Frogs  Lab  Xenopus

Temperature profiles high and low

22 May 2023

Getting high to work out how low they can go

Invasive species often have large native ranges that encompass a number of different environments. The African clawed frog Xenopus laevis is most commonly referred to as coming from a Mediterranean climate. However, in its native range this species is almost ubiquitous in all of southern Africa from the Highlands of Malawi through the tropical lowlands of Mozambique and KwaZulu-Natal, and in the deserts of the Karoo and Namibia. Included in this natural range is a remarkable elevational gradient from sea level all the way up to over 3,300 m in elevation. 

We were interested in sampling animals along this elevation gradient to determine how they changed in the thermal performance curves. Back in 2020 Laurie sampled animals every 1,000 m in elevation (see blog post here). We also left temperature loggers at all of these sites to see how the natural environments varied over the course of a year (see blog post here and here). 

The results of Laurie's study are published today and show that the thermal profile of animals has a left shift to lower temperatures as they move up the elevational gradient. This means that animals that we captured in Lesotho have a lower optimal temperature for their endurance performance. However, the upper temperature limit for all of these animals was the same irrespective of where they were collected.

The results of this study put a rather different context on the potential of this species to invade different areas outside their native range. We now know that the species can tolerate very cold temperatures throughout the year at higher elevations. 
Although this work sounds relatively simple, don't forget that Laurie had to chase these frogs at lots of different temperatures all day every day for weeks and weeks. This represents an incredible amount of work. Well done Laurie!

Read more about this work at:
Araspin, L., Wagener, C., Padilla, P., Herrel, A., Measey, J. (2023) Shifts in the thermal dependence of locomotor performance across an altitudinal gradient in native populations of Xenopus laevis. Physiological and Biochemical Zoology Journal https://doi.org/10.1086/725237
  Frogs  Lab  Xenopus

Starting your PhD

27 April 2023

How to Start your PhD

In some parts of the world the time-line is just getting started for new PhD students. This will be a very busy time for those involved, but it also needs to be a time to take stock and consider the bigger questions. In this video I provide some pointers to key issues for you to think about when starting your PhD. 

Warning - I do speak pretty slowly in this video, and so I think it's worth speeding it up so that you don't fall asleep. 
Here are some key excerpts from the text of a new chapter with links to How To Write a PhD in Biological Sciences:

Creating a conceptual framework of your PhD thesis

An important phase at the outset of your PhD project is to plan the chapters that are going to be in it. Think about the contents of your PhD and commit as many thoughts and ideas as you can to paper. If you aren’t sure how to get started, then think about how to answer the following questions:

  • What questions are you going to ask?

  • What is your study system?

  • How will you collect your data?

  • What are the most important variables that you will measure?

  • What techniques will you use?

  • Do you have hypotheses?

All these ideas (and more) are going to be swirling around your mind at the beginning of your PhD and you’re going to need to commit them to paper, and doing this right now at the start is the best time. If you haven’t done so already, write them all down. If you can do a mind map or some kind of graphical representation, this will be good for you if it suits the way that your mind works. Otherwise, you can use a series of lists and bullet points, if that is more your style. The important point here is be able to move from a jumble of ideas and thoughts into a formal plan for your thesis.

A thesis typically has five data chapters that are presented in a linear fashion (book format), bookended by an introduction and conclusion. At the heart of each chapter is going to be a hypothesis, a question or a technique that the following chapters implement in order to get their results.

It may help you to use distinct colours and short titles (just a couple of words) for each chapter so that you can efficiently communicate them to your advisor, and use them as file names for the sections (don’t use “Chapter 1” as your chapter name!). You should then use these same colours and short titles in your thesis timeline (Gandtt diagram) used in your proposal.

Once you have some rough ideas for your thesis plan, discuss it with your advisor and get their opinion. Then map it out on a piece of paper. But, be warned, it probably won’t be anything simple or linear - it’s likely to be more complex that the one illustrated below. It should have a lot of links and arrows that join all of the chapters to each other in different ways. It may help to code these links so that it’s clear what they represent. For example, you may want to use one colour for data and another for techniques and results. Although the detail is important, remember that the conceptual thesis plan is supposed to give an overview of the way in which the thesis works. This means that you might need to remove some of the minutiae in order to provide a clearer overall picture that others can easily follow.

A conceptual thesis plan will be placed in the introduction to your thesis. In this (fictional) example, I show how how the different chapters are linked by a single technique (developed as a chapter of the thesis: grey arrows), and data that results from each of the chapters (blue arrows).

A conceptual thesis plan will be placed in the introduction to your thesis. In this (fictional) example, I show how how the different chapters are linked by a single technique (developed as a chapter of the thesis: grey arrows), and data that results from each of the chapters (blue arrows).

To read more on this topic, please refer to the book!
  Lab  Writing
Creative Commons Licence
The MeaseyLab Blog is licensed under a Creative Commons Attribution 3.0 Unported License.