Subscribe to MeaseyLab Blog by Email

Talk for SU library on Open Access

24 October 2017

Stellenbosch University Library talk for Open Access week

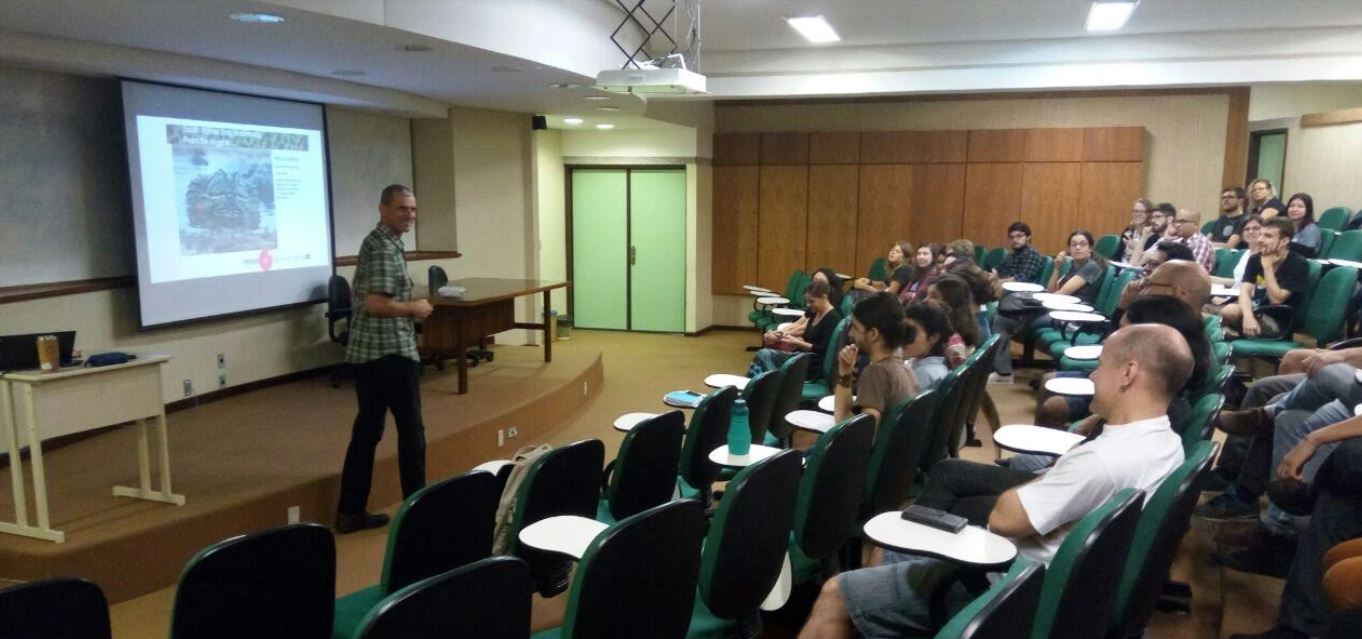
Today I gave a talk "I put my journal behind a paywall,so why am I talking to you about Open Access? in Stellenbosch University library based on two blogs published earlier this month: A rant for Open Access weekWhy do I like publishing with PeerJ?

It was nice to reflect on my time as editor for a society journal, but I learned a lot about the fantastic work that SU library is doing. Not only do they curate the self archived papers of staff which are then Open Access for all, but they also act as a host for 25 Open Access journals. This is a laudible and totally fantastic role for a university library as paying to host the content of a journal can be costly, especially when it comes to keeping this going in perpetuity.

You can read more about SU library's Open Access initiatives here

Thanks to Sarah D for taking some pics!

  Lab  News

Why do I like publishing with PeerJ?

23 October 2017

Why do I like to publish with the Open Access journal: PeerJ?

The academic journal PeerJ has now been going for 4 years. I learned of its existance early on in 2013, from a colleague at NMMU, and quickly started reading more about it. In addition to being Open Access and not impact focussed (the importance of which we'd learnt from PLoS-ONE), I was initially attracted by their policy of publishing reviewer and editorial comments. This was the transparancy that I'd craved for a long time. Credit and accountability for reviewers and editors, allowing them to take their game to the next level. All reviews can be cited as each carrys a doi. This is a great way for students to learn about the peer review process, and demystify it for interested members of the public.

Next, I was drawn by the novel idea of membership for authors. You can buy three levels of life-time membership entitling you to publish one, two or as many articles as you like for the rest of your life. The inital rates have changed somewhat (see here), and there are some extra requirements, but the spirit of PeerJ as a community continues. PeerJ has now added an Article Processing Charge (APC) which makes it look more similar to other Open Access journals (currently standing at US$ 1 095). This doesn't make the old memberships invalid, but allows for easier fiscal understanding of univeristy finance departments; not many of them understood the membership system. The PeerJ APC is also much more reasonable than that of most other APCs, but it continues to be out of my reach. Sadly, I can really only afford to publish on my existing membership (and with other members).

There is real care in the copy-editing process. The PeerJ staff are a pleasure to interact with, and they really do care about what is published under their banner. They will follow through with the last wishes of the handling editor and make sure that all of your permissions are what they claim to be. There is the real feeling that it's a quality product, and this draws community loyaly: it's certainly got mine.

Lastly, there are a bunch of extras that make PeerJ a pleasure to work with:

  • The aesthetically pleasing clean look to both their articles and website as a whole. 
  • The clear instructions and community guidelines 
  • The up to date policies and procedures
    • Copyright to authors
    • Clear requirements for who gets to be an author
  • Publication ethics
  • Data sharing

I've now published 7 papers with another already in review. I've edited a further 12 and you can see my current record here. The journal has published 4 041 papers, and there are a few spin-off publications in the same stable: PeerJ Computer Science and PeerJ Preprints. 

  Lab  Writing

Urban frog invasivions

23 October 2017

Does restricted access limit management of invasive urban frogs?

In a paper published today, we ask whether restricting access to properties could limit the success of management interventions when controlling or erradicating three different invasive frogs. And it does!

We chose the scenario of Constantia in Cape Town as our peri-urban environment where Gio did his PhD study on invasive Guttural Toads.

We then used life history information from each of these three species to build models for their invasions. 

The results show just have different invasions can be with different amphibian ecotypes.

This paper came about due to our participation in the Urban Invasions Workshop in November 2016. Read my blog post about it here.

Read the paper here:

Vimercati, G., Davies, S.J., Hui, C. & Measey, J. (in press) Does restricted access limit management of invasive urban frogs? Biological Invasions  doi:10.1007/s10530-017-1599-6  doi:10.1007/s10530-017-1599-6


Talk for University of Mauritius

18 October 2017

Nice turnout for talk on invasive frogs at University of Mauritius

I gave a talk to the conservation class of Prof. Vincent Florens at the University of Mauritius, together with other luminaries who pitched. Using amphibians as an example of how to score impacts for invasive species. There were a lot of agreeing nods and understanding here when talking about invasive species. They have so so many and see the impacts daily. 

Watch out for a detailed blog on the Mauritius trip coming soon...

  Lab  meetings  News

SD or SE?

18 October 2017

Should I be using the SD or SE? Standard Deviation or Standard Error?

I’m surprised that there are so many poor answers to this question out there, so I’ve decided to write my own, just in case my poor answer helps you any better.

The Standard Deviation

The Standard Deviation is a description of how much spread there is around the mean. You can find the formula all over, so I won’t repeat it here. A small SD indicates that your data points are closely clustered around the mean, and the larger your SD gets the more the data is spread, in a normal distribution. However, there is some intrinsically useful information that the SD carries which may help you decide whether or not you should be using it. If your distribution is normal (and yes, you should have already tested for this), then the SD tells the reader that around two thirds of the data points in your data set fall within one SD of the mean: that is the mean plus 1 SD and the mean minus 1 SD. In addition, the units of SD are practically the same as the units that you have used to collect your data and display your mean. Thus, the SD is providing your reader with a descriptor of the mean that is quantifiable and can be easily interpreted.

You can report the SD in text as follows:

Our data show that males (n = 353) were larger (387.5 ± 49.37 mm) than females (n = 321; 245.4 ± 27.61 mm).

Note that I’ve not used the terms mean or standard deviation in the text above, this is because you should set this up in your material and methods section. If you need to change between the SD and SE in your results, then you will need to indicate which is which when you report it. I have used different levels of accuracy (decimal places) for means and SD. This should be relative to how you actually measured your data. In this case, I measured animals to the nearest mm, so report the mean to one decimal place and the SD to two. Although there is no strict rule, you should not be reporting a mean with far greater accuracy that you actually measured it (e.g. to four decimal places). Note also that the sample size is given for each set. It is very important to provide this information somewhere. There may be instances (such as an experiment) where these numbers are set throughout the document, and so don’t need to be repeated in the text each time you report a result. 

Standard Error

The purpose of the Standard Error is to inform the reader on the likelihood of the mean. In many biological studies, we take the sample from a population that is much larger because we can’t measure all individuals. In our example above, we see that males were larger than females, but how likely is it that the mean we obtained reflects the true mean of the entire population, both sampled and unsampled?

By now, you should have come to the conclusion that the SE is useful when comparing means. In a graph or table where you are interested in demonstrating whether or not the means are different, you can use the SE as error bars around the mean. Note that the convention is that you have plus or minus two SE in error bars (two SE above and two SE below the mean). This is because 2 SE is equivalent to a 95% probability that the mean falls within this range, meaning you’d be very sure. Showing 1 SE either side only shows that you are 68% sure, which doesn’t help much if your test statistic is 0.05. Either way, just make sure that you clearly indicate what you have done in the figure legend. In addition, you will probably want to conduct some statistical test to show that the data are indeed different. Interestingly, statisticians are moving away from many of these tests (or at least the test statistic). If you have used the SE correctly, your graph should speak for itself and there is no real need to carry out a test. In cases where it appears marginal, a test can be useful. Alternatively, you should go back and measure more animals!

In summary

In summary, the SE is telling us about the variability of the population mean (in relation to the one we measured), while the SD is giving information on the variability of the data points that we collected around their mean.

Standard Deviation or Standard Error?

To try to answer the original question posed above. You are most likely to report the SD in your text when describing the data you collected, and the SE on a graph demonstrating how likely it is that the means you obtained represent the entire (only partially sampled) population.

Read on...

If you didn’t understand the above, or want to read more on the (relatively) simple logic of how and why the SD and SE are calculated and derived, I suggest that you look for:

Streiner DL (1996) Maintaining Standards: Differences between the Standard Deviation and Standard Error, and when to use each. Can J Psychiatry 41:498–502.

I am indebted to Don Kramer for pointing me toward the above paper.

  Lab  Writing
Creative Commons Licence
The MeaseyLab Blog is licensed under a Creative Commons Attribution 3.0 Unported License.