Communicating by email
You will be expected to communicate with your advisor and other professionals inside and outside of academia using email. The chances are that you have already written a great deal of emails in the past. However, this does not mean that the style and content of those emails will be appropriate when communicating during your postgraduate studies.
In addition to meeting in person, email has become a standard way of communicating between students and their advisors. Although other platforms for communication are available (e.g. Slack), email has the advantage that it provides a paper trail (time stamped, and institutionally traceable), is rapid, can include attachments and can include additional advisors or collaborators.
Email is a very low-cost method of communication, but it isn’t free. Every email sent takes energy to send it, and the bigger the size (especially sizes of attachments), the more electricity is used to send them through your institutional server, or beyond. In addition, storage of emails costs money and energy. This is actually a reason why you should not be sending superfluous emails as the bigger they are, the more energy they use.
An important point about emails is that they can be kept and/or forwarded to third parties. This means that you are best advised not to include any content that might be considered (by anyone) as risky or contentious. In particular, avoid anything written about any third party, unless you are happy for them to see what you have written.

Writing Style
In general, it’s best to keep your style brief. If you feel that you need to write a long email, consider ways in which you could better communicate the same information in a meeting, or in responses to comments in a chapter draft. I would discourage you from writing long emails as reading them will tend to take up more of your advisor’s time than other forms of communication.
One of my pet hates are emails that start with “I hope this email finds you well” or some such banality. This is not a professional way to start an email, especially with someone that you don't know. I’m not entirely sure why it provokes so much ire in me, but any email that I receive that starts this way instantly puts my back up. Obviously, there are people that I work with that I know well, and sometimes they may be sending a genuine inquiry and I have no problem with this.
Think of it this way, don’t ever start an email with any kind of statement or question that you don’t actually want answered. I can tell you right now that I am well - or if I happen to be unwell, will not be telling you any information about this in any email correspondence.
The subject
Do include a succinct subject for your email. Do not leave this blank. Remember that your advisor, and other professionals that you communicate with, likely receives many emails in a day. They may not be able to respond to you immediately, but may want to know what the email is about before they open it.
The subject is especially important if you need something quickly (e.g. something signed, or for permission). If this is urgent, you might consider saying when the deadline is in the subject line. Obviously, you should avoid making urgent demands from anyone in your professional world, but sometimes this is necessary and everyone will understand. However, if you fail to communicate this in the subject of your email, don’t be surprised if your request is sidelined until after it’s too late.
Formality
The level of formality that you use will largely depend on your existing relationship with your advisor. I am happy for people to start any email with “Hi”, but other advisors might prefer something else. If you are unsure about your advisor, then ask them. As a default, you should use the same style that they are using to address you.
When emailing someone that you don't know, use the most formal style: "Dear Dr. Blogs" or "Dear Prof. Bliggs". If you don't know what their rank is, use an appropriate level that you consider likely. Remember that there are conventions in different places (e.g. every academic in the US is a Prof.; in Europe Prof. is reserved for the highest rank only, and everyone else is Dr.). Similarly, when you sign off, use a formal sign off. As a general rule of thumb, you can use how they sign off their email to address them. For example, if I sign off an email "With best wishes, John", I expect that you will reply with Dear John or Hi John. However, if I sign off "With best wishes, John Measey", then I am looking for a more formal response starting with "Dear Dr. Measey".
Remember that if you cc in others, you should move your formality accordingly. Bear in mind that emails can be kept or forwarded without your knowledge. You do not want to regret a particularly lax use of formality at a later date.
In general, emails that you write as a postgraduate student are professional communications, so keep them as such. Let brevity be your watchword.
Why exactly are you communicating?
The first two or three sentences of your email should state why you are communicating and whether or not you are expecting a reply. Emails can be just for information, keeping someone up to date on your progress or letting them know that something they asked for has been done. If this is the case, then start your email with a statement letting the recipient know the reason why you are keeping them informed, and that you don’t expect a reply.
If you require a response from your recipient concerning a particular question, then you should flag this in the first line of your email. If their response is time sensitive (i.e. you need a reply before a certain date) then state exactly when this is. In the subsequent information that you write in your email, you need to make the question or questions clear.
Using structure
I like it when people use some structure in their email. If it’s going to be a long email (which I’d advise against) then do include a short summary explanation at the start so that the reader knows what the email is about (especially if the subject line doesn’t fully explain). Using bullet points or numbered points in the email is also a great way of using structure, especially when you expect a reply on each point.
Replying inline
This simply means that the previous email is reproduced when you hit reply, often with some marker for what was written originally. I like inline replies as it’s simple to see that each point has been addressed. It’s also a useful way to be reminded of what was originally written.
Some email chains start to become a bit tedious when many inline responses make them so cluttered that it’s hard to see what’s going on any more. Use your common sense to decide when it’s enough.
HTML emails or plain text
Most email software now defaults to emails written in HTML, which means that you can use bold, italics, bullet points and most other features that you would in a word processing package. Some people prefer plain text only, but HTML is becoming more standard.
Email chain
Most email software has an option to include the original message in the reply. This is quite useful in that it can remind everyone about what was asked. As these kinds of conversations get longer, they can become very large and unwieldy.
Reply All
Some email software has Reply All as the default option whenever you hit reply. If yours does this, I’d urge you to change it immediately. The use of emails to large numbers of recipients is common, but it gets extremely annoying when half of this list hits Reply All just to confirm receipt or even worse give some inane chatty response.
If you are going to use Reply All, before you send the email check:
-
that it is appropriate everyone on the list receives your reply
-
that there is not inappropriate information in the email chain
-
that you have added the correct attachment
Bullet pointed or numbered lists
I think that both of these are appropriate when you have a number of points that you’d like addressed.
Send Later
This is a new feature on many pieces of email software that I really like. Essentially, it allows you to compose an email and stipulate the time and date that you want it to be sent. I find this very handy if I know that someone is on leave. I'd prefer that my email not sit in their backlog, but arrive once they are back from being away and have already cleared theirinbox.
Anotherscenario that I use for send later is when I have a deadline, but am awaiting feedback. I can make sure that I meet the deadline by sending the email with report or manuscript attachment or whatever it is that I have to send before the deadline. However, if at the 11th hour I get the feedback from the third party that I'm hoping to include, I can still find the email with report (it's usually in the Draft folder), make any amendments and then send it off.
Use of all Capital Letters - DON’T DO THIS!!!!
When reading any email when parts are written in All Caps, this comes across as someone who is shouting (see use in subheading). Not something that you should be doing in any professional communication. If you need to, then use bold or italics to emphasise points.
Similarly, I’d appeal for younotto use excessive exclamation points, slang (especially swearing) or other such frivolities in your professional email. It’s simply not a way of communication that you should be doing at work. Write emails to your friends like this if you want to, but I’d suggest that you do this from a private email account (and not your institutional address).
High Importance
Some email software has the ability to flag an email as important. Avoid using this unless you have something with real importance, like some decision or response needed that same day. Otherwise, try not to use this feature.
When to CC someone
Only Carbon Copy (CC) someone if there is a real need for them to be included on the email. In reality, multiple addresses can be added in the To field, and anyone that the email is written to should be listed there.
In the business world, a lot of email correspondence includes the entire team in CC. This is usually not needed for academia. If you are in any doubt about whether or not to include someone in CC, then ask your advisor.
If you do put someone additional in CC, then it is polite to note this in the email. For example, in the initial salutation you could write “Dear Sue and Bob (and Warren in CC)...” I like to indicate the reason for including someone in CC at the appropriate point in the body of the email. This lets everyone know exactly why they have been CC’d. For example, “Dear Sue and Bob, I am writing regarding the delivery of the 33 g steel ball that Warren (in CC) and I ordered on 12th November this year.”
Remember that someone in CC will be in CC again if the person you are writing to hits Reply All.
Use of BCC
Blind Carbon Copy (BCC) is a very useful way of copying in another person without the original person or anyone in CC knowing. But you should use this feature of email with extreme care. Many people who receive an email in BCC are not immediately aware, and it has happened to me that people I have BCC’d have then hit “Reply All” and immediately disclosed their presence on the email. This is very embarrassing. Thus I would urge you to only use this when the person you intend to BCC is aware of the fact.
A common use of BCC is when emails are sent to a great number of people and to avoid having anyone use Reply All. If you have a great number of collaborators (for example on a literature review or a large author list), then you can address the email to yourself (or your advisor) and BCC everyone else.
Note that if someone is on BCC, then they won’t get included when any of the rest of the group (addressee and CC) hit Reply All.
Forwarding emails
Oneof the most common ways of emails being inappropriately shared is when they are forwarded, or additional people are added to a reply much later in an email chain. I have received many emails where the sender was clearly unaware of what the chain contained.
In general, it’s not often appropriate to forward emails to others.
Out of Office autoreply
I find the autoreply saying that someone is away very useful. It lets you know whether or not to expect a reply, and might mean that you then write to someone else instead. If setting your own Out of Office autoreply:
-
Do include the date when you will be back (and check that it’s correct when you send it)
-
Do state whether you are on holiday or in the field
-
If there is another means of reaching you (when you aren’t on holiday) then give this
Signing off
How is it best to sign off? Most professional emails sign off with one of the following:
-
With best wishes
-
Kind regards
-
All the best
Any of these is fine to use, as are the more formal classic letter writing “Yours faithfully” or “Yours sincerely”.
I quite like it when people sign off using their own language, as it (somehow) makes it more personal and sincere. I have worked in a number of countries around the world, and when there tried to use appropriate local language words to start and end emails.
Using email signatures and banners
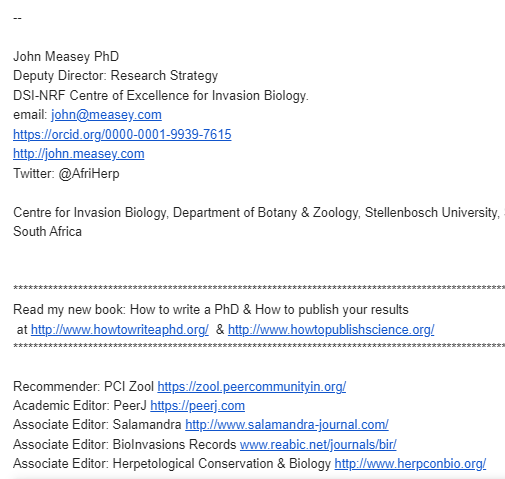
An email signature is a useful way of explaining who you are at the end of your email. I find them very useful sources of information like websites, telephone numbers, physical locations (i.e. address). They can also include more information. For example, my signature currently contains a list of journals that I edit for and links to this (and other) books. For this reason, signatures are useful, especially on first contact. Thereafter, signatures don’t really need to be sent with replies and in email chains. Most email software contains options for when signatures are sent.
Some institutions will automatically add a pictorial banner to the bottom of every email sent, advertising how great they are. Others will add long legal statements with disclaimers. Obviously, you will have little power over whether or not these are included by your institution. However, some students create and add their own banners to their emails. I would discourage this simply because it takes more energy to send, and uses up considerably more space than text only signatures.
Using emails as a record of due diligence
For students that are having problems with their advisor, especially with lack of communication, or non-communication, email provides a very important record to document your due diligence, as well as being able to document your advisor’s lack of timely response (hopefully you already have a student-advisor agreement to refer to). Make sure that you use your institutional email address and the institutional address of your advisor. If they prefer another address, use this in cc in addition to their institutional address. The reason for this is that if you are going to use this paper trail to document your communication, you will need to produce these emails for your institution and they may only consider emails that have been sent using their services.
If you suspect that you may need to use your emails in this way in the future, it is worth re-reading them, prior to sending them, and think about how they could be interpreted by a third party.
If you are communicating with your advisor on a web based platform (like Slack), then do you need to send them emails aswell?
In most institutions, postgraduate students and advisors sign agreements before they start working together. It is well worth looking at this agreement and see what you've signed up to. I would maintain that at any point that your agreement states that you need to 'communicate' with your advisor, this should be done via email. Similarly, if the agreement talks about you needing to send thesis drafts, do these via email. As stated above, emails are useful because they can be traced, and institutional emails especially so. If either party claims that they 'did no receive' an email, this can be independently verified. If you sent something via Slack and at some point your advisor claimed that you didn't, how do you verify this later?
Of course, everyone hopes that there won't be a breakdown in communication during your studies. However, it's worth starting your professional career as you mean to go on.
Interested in reading more about writing?
The above text is now included in the book: How to write a PhD in Biological Sciences. This Open Access book is free for you to read, but you can write to me and ask for additional chapters or sections (like this one) to be added. The book is dynamic and relies on you to say what you need in order to grow it into something that is more useful to everyone.
