Subscribe to MeaseyLab Blog by Email

Type I and Type II errors

13 March 2021

Being aware that you can get it wrong


With all the will in the world, when you are testing your hypothesis using statistics there is a chance that you will accept your alternative hypothesis when it is not valid. This is known as a ‘false positive’ or aType I error. It is also possible that you will accept your null hypothesis when you should have accepted your alternative hypothesis, also known as aType II error,or a ‘false negative’. While it won't be any fun to get a Type II error, as scientists we should be more worried about Type I errors and the way in which they occur. This is because following a positive outcome, there is more chance that the work will be published, and that others may then pursue the same line of investigation mistakenly believing that their outcome is likely to be positive. Indeed, there are then lots of ways in which researchers may inadvertently or deliberately influence their outcomes towards Type I errors. This can even become a cultural bias that then permeates the literature.

Humans have a bias towards getting positive results (Trivers 2011). If you’ve put a lot of effort towards an experiment, then when you are interpreting your result you might feel motivated towards your reasoning making you more likely to accept your initial hypothesis. This is called ‘motivated reasoning’, and is a rational explanation why so many scientists get caught up in Type I errors.  This is also known as a confirmation bias and we will discuss it in more detail elsewhere on this blog (see here). Another manifestation of this is publication bias which also tends to be biased towards positive results (see here). Put together this means that scientists being human are more vulnerable to making Type I errors than Type II errors when evaluating their hypotheses. It is important to understand that simply by chance you can make a Type I error, accepting your alternative hypothesis even when it is not correct. 

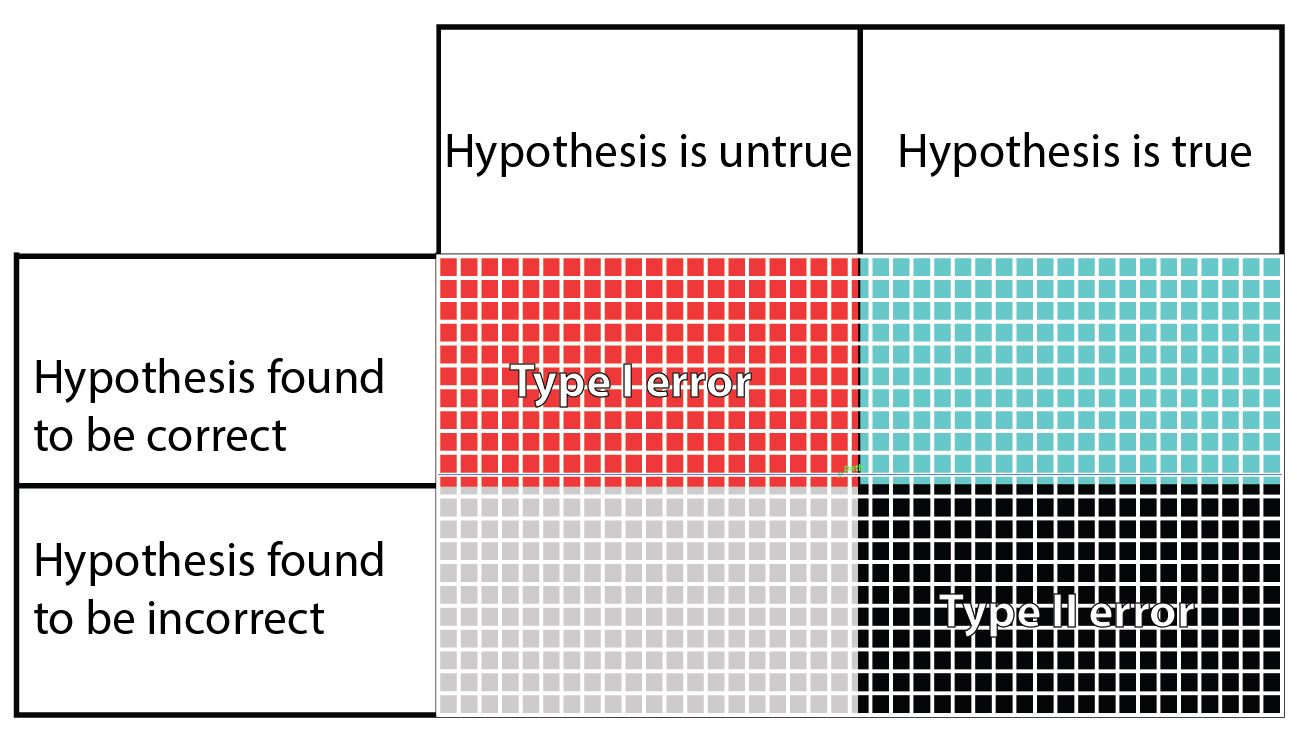
In this table, the columns refer to the truth regarding a hypothesis, even though the truth is unknown to the researcher. The rows are what the researcher finds when testing their hypothesis. The blue squares is what we are hoping to achieve when we set and test our hypothesis. The grey squares may happen if the hypothesis we set is indeed false. The other two possibilities are the false positive Type I error (red), and the false negative Type II error (black). In the table it seems that the chances of getting one of the four outcomes is equal, but in fact this is far from reality. There are several factors that can change the size of each potential outcome to testing a hypothesis.
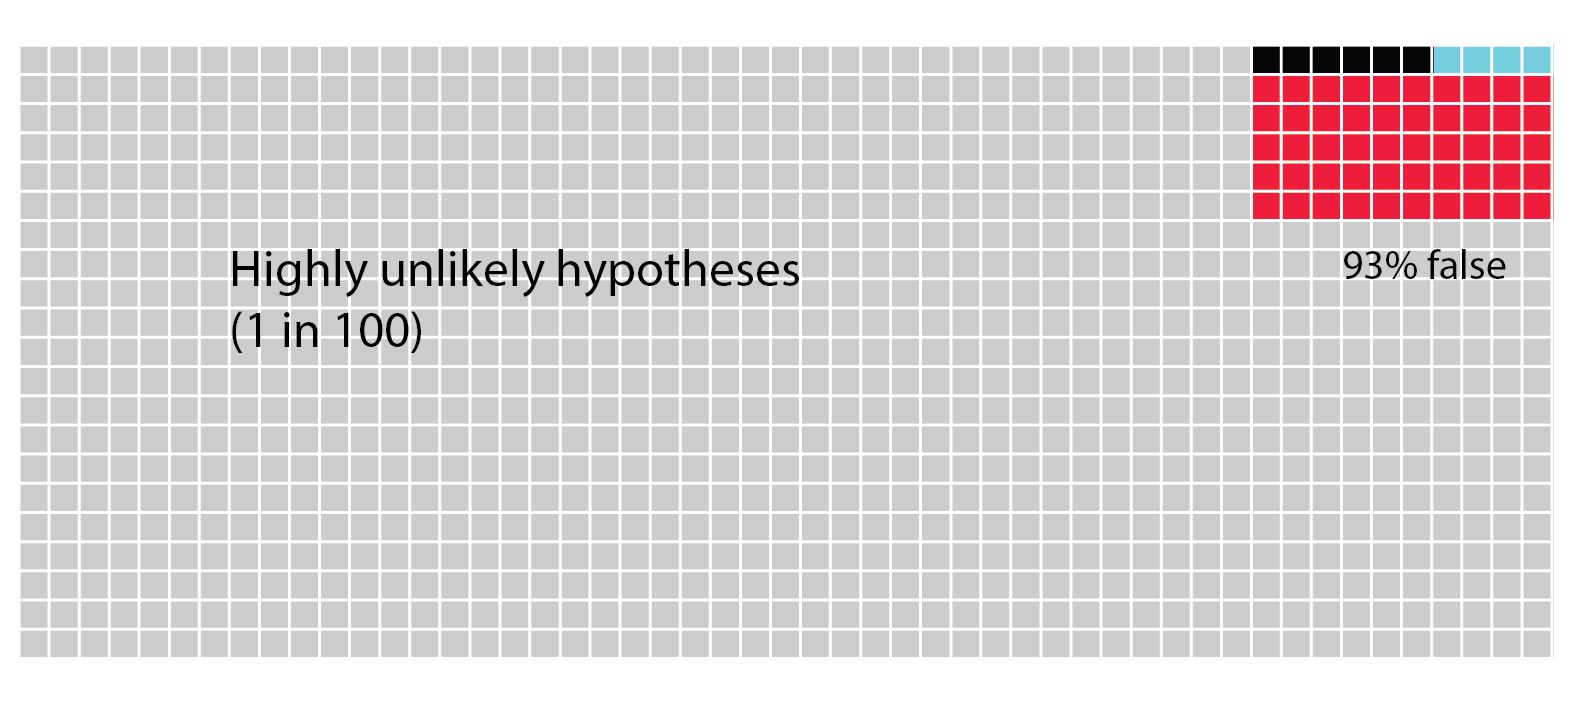
The following figure has been redrawn after figure 1 in Forstmeier et al (2017). This is a graphical representation of an argument first made by Ioannidis (2005). Each figure shows 1000 hypotheses. You could think of these as outcomes of 1000 attempts at testing the same hypothesis, or as a more global scientific effort of testing lots of hypotheses all over the world. The difference between the figures is the likelihood that the hypotheses are correct changes. In the first one we see highly unlikely hypotheses that will only be correct one in a hundred times. The blue squares denote the proportion of times in which the hypotheses are tested and found to be true. The black squares denote false negative findings, i.e a Type II error. The red squares denote false positive findings, i.e. a Type I error. Because the hypothesis is highly unlikely to be correct the majority of squares are light grey denoting that it was correctly found to be untrue. Although it might seem unlikely that anyone would test such highly unlikely hypotheses, there are increasing numbers of governments around the world that create incentives for researchers to investigate what they term blue skies research, which might be better termed high risk research or investigations into highly unlikely hypotheses. The real problem with such hypotheses is that you are more likely to get a Type I error than actually find that your hypothesis is truly correct. 
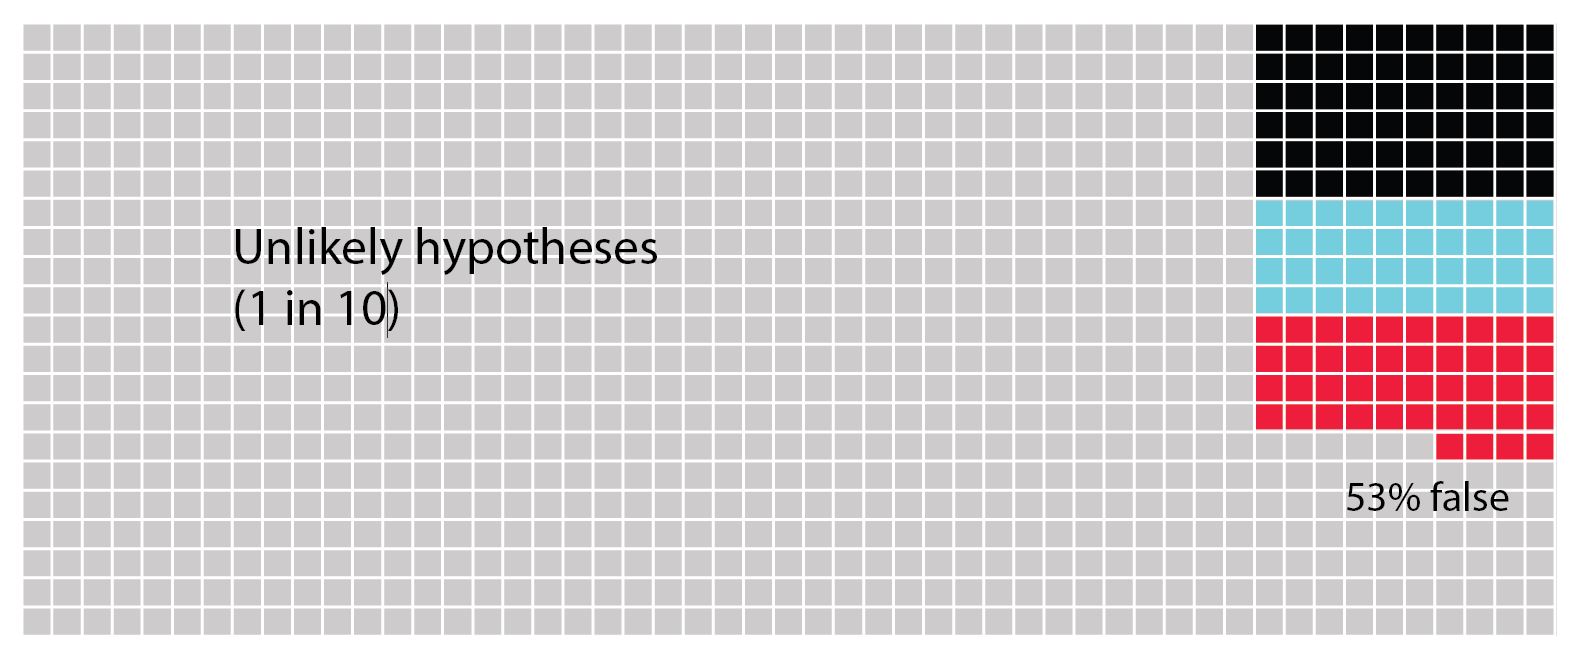
In the next figure we see a scenario of unlikely hypotheses that are found to be correct approximately one in 10 times. Now we see that the possibility of committing a Type I error is roughly equivalent to a Type II error and to the probability of finding that the hypothesis is truly correct. Thus, if your result comes out positive, you are unlikely to know why.
Lastly we see the scenario in which the hypotheses are quite likely to be correct one in two times. Now we can see that the possibility of creating a Type II error is highest. Next the blue squares show us the chances that we find the hypothesis is truly correct. Lastly, there's only 11% chance of a type 1 error. 
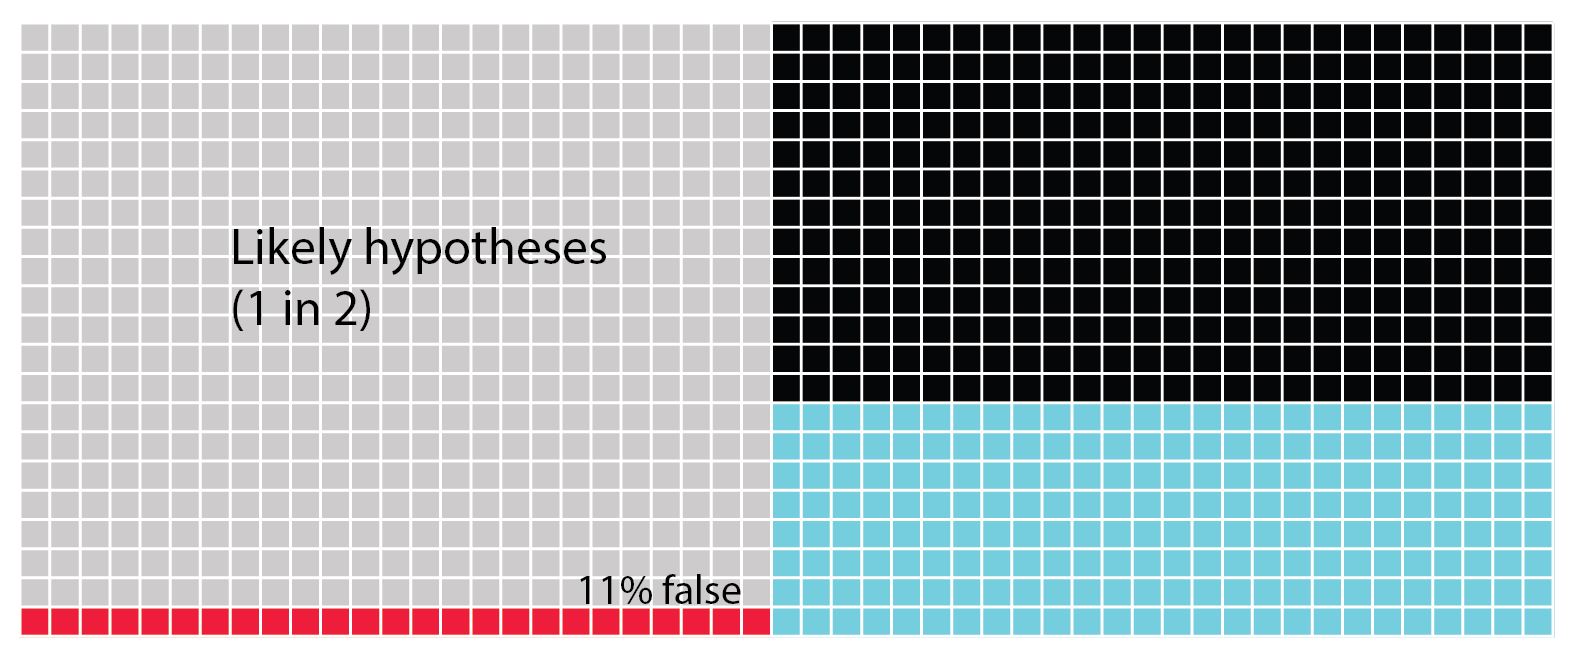
In all of these figures (above) the power of the analysis is set at 40%. The statistical power of any analysis depends on the sample size (or number of replicates) you're able to use. Some research has suggested that in most ecological and evolutionary studies this is actually more like 20% (see references in Forstmeier et al 2017). What is important to notice in the next figure (below) is that when we change the power of the analysis (in this case from 40% to 20%) we influence the proportion of Type II errors over finding that the hypothesis is correct. While the overall numbers of Type I errors does not change, if your analysis tells you to accept your alternative hypothesis, there is now a 1 in 5 chance (20%) that it will be a false positive (Type I error).
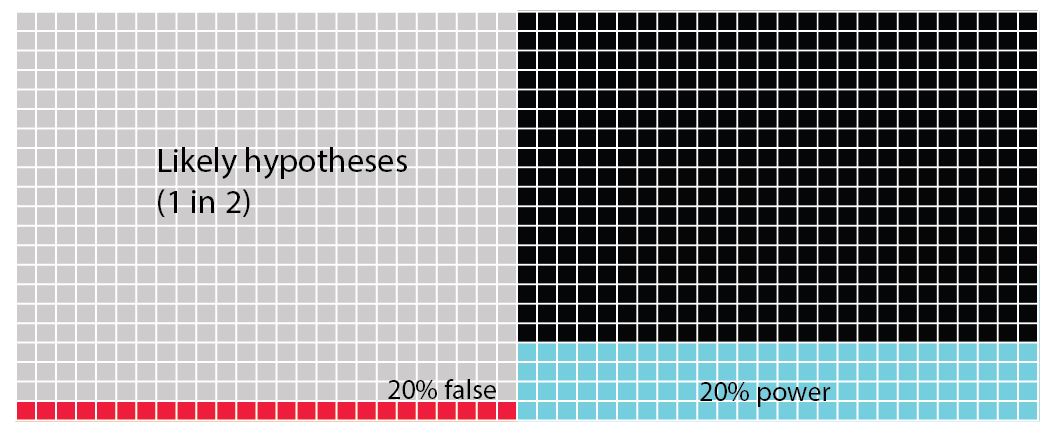
What you should see when you look at these figures is that there is quite a high chance that we don't in fact correctly assign a true positive hypothesis. There's actually much more chance that we will commit a Type II error. Worse the more unlikely a hypothesis is, we are increasingly likely to commit the dreaded Type I error.

From the outset we should try to make sure that the hypotheses you are testing in your PhD are very likely to find positive results. In reality, this means that they are then iterations of hypotheses that are built on previous work. When you choose highly unlikely hypotheses, you need to be aware that this dramatically increases your chances of making a Type I error. The best way to overcome this is to look for multiple lines of evidence in your research. Once you have the most likely hypothesis that you can produce, you need to crank up your sampling so that you increase the power of your analysis, avoiding Type II errors.


References

Forstmeier, W., Wagenmakers, E.J. and Parker, T.H., 2017. Detecting and avoiding likely false‐positive findings–a practical guide.Biological Reviews,92(4), pp.1941-1968.

Ioannidis, J.P., 2005. Why most published research findings are false.PLoS medicine,2(8), p.e124.

Trivers, R., 2011. The folly of fools New York.NY: Basic Books.
  Lab  Writing

Altitudinal transect - sea to summit

05 March 2021

Sea to summit - with frogs all the way

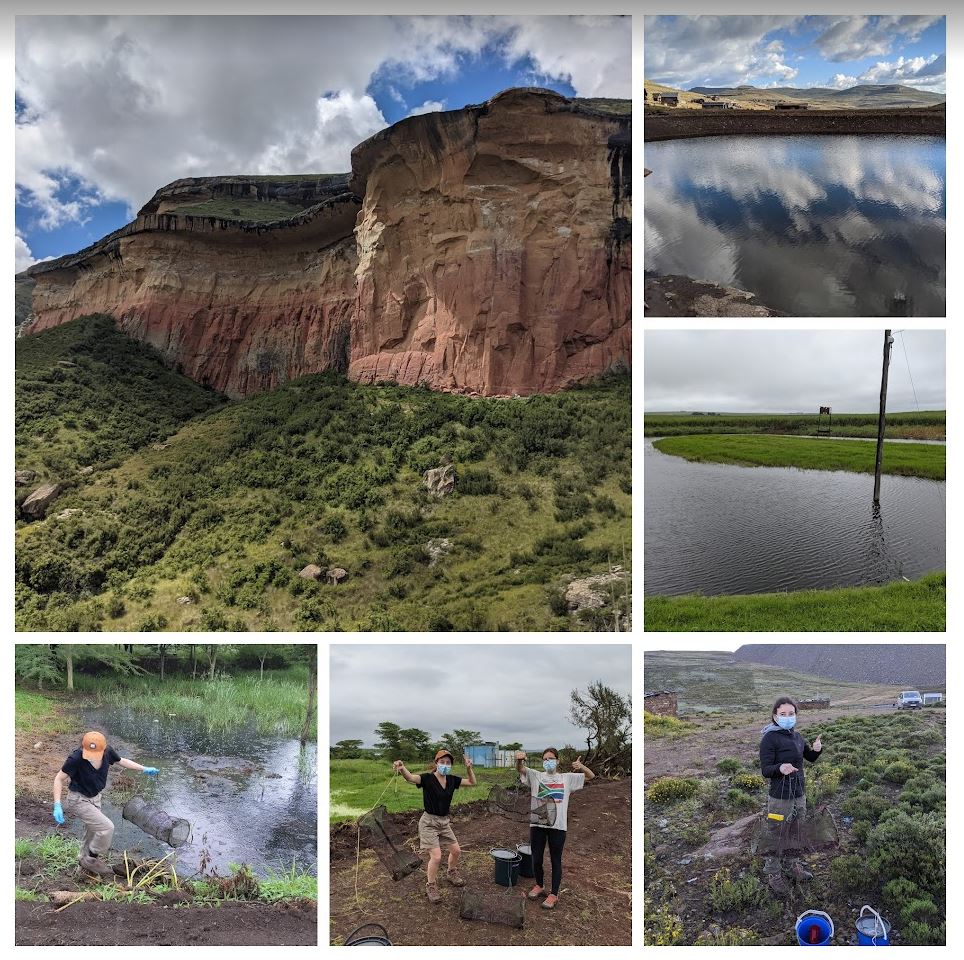
The African clawed frog, Xenopus laevis, is remarkable for many reasons. One of these is the distribution of these frogs in southern Africa. Not only can you find these frogs from the highlands of Malawi all the way to the most southerly point in South Africa, but you can also find them right on top of the highest mountain in Lesotho at 3200 m asl. 

The challenge for Laurie Araspin, co-tutelle student with the MeaseyLab and Anthony Herrel's FunEvol Lab at the Muséum National d'Histoire Naturelle in Paris, was to collect frogs at every 1000 m interval of altitude to determine how their physiology changes as altitude increases. 

From the sewage works in the rain at near sea-level, all the way up to the highest points of Lesotho, Laurie succeeded in finding all of her frogs. 

  Frogs  Lab  Xenopus

Reasons to be cheerful...

12 February 2021

Welcome to Laurie - and lots of other reasons to celebrate...

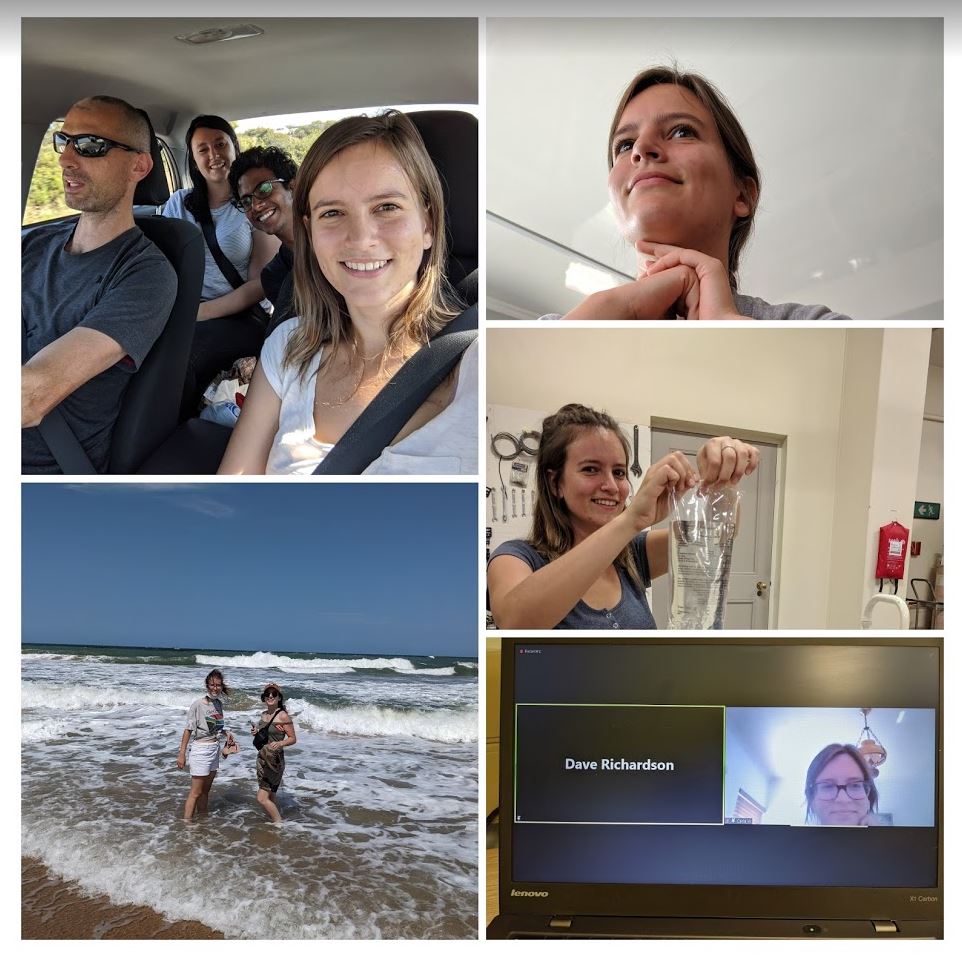
After nearly a year without being able to meet up, the MeaseyLab managed to meet today to celebrate lots of things that have happened.

Welcome to Laurie - who managed to make it to South Africa from Paris to conduct her PhD project on Xenopus laevis in South Africa (part of a co-tutelle with Anthony Herrel at the Natural History Museum in Paris). 

Congratulations to Carla - who had her Hons project accepted for publication (more on that soon).

Very well done to Andrea - who has finished his work on Raucous and Western Leopard Toads, and welcome to Novella visiting from Milan

Siya and Sam are also to be congratulated for all their hard work and perseverance in the lonely pandemic world of SU kepp up the good work guys! 

  Lab  meetings  Xenopus

Fire toadlets

30 January 2021

After the fire: how Rose's Mountain toadlets survive fire in the fynbos

One persistent riddle in this part of the world is how animals survive the regular fires that regularly engulf and rejuvenate the native fynbos vegetation. It's been know for a long time that the plants have evolved sophisicated techniques to use the fire to survive or repopulate areas. But most surveys after fires suggest that lots of animals perish. So how do populations survive?

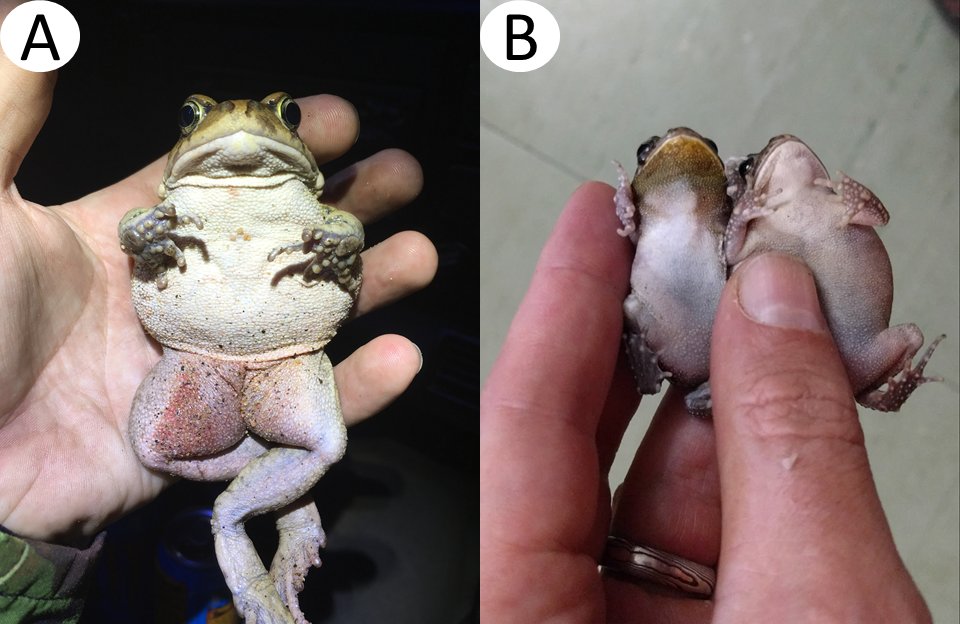
The 2015 fire on the Cape peninsula allowed us the opportunity to visit our long term monitoring site for Rose's mountain toadlets, Capensibufo rosei  (see previous blog posts on this species here and here). Within 10 minutes of arriving at the winter breeding site, we spotted a toadlet hopping through the ashes. As I filmed it (see below), it suddenly disappeared into a hole. Stripping away all the vegetation allowed us to see that the toadlets use underground burrows of Cape gerbils to shelter from the harsh mediterranean summer sun. Presumably, being in these holes during a quick fire allows them to survive being burnt to a crisp. 

In a note that was published this week (Measey et al., 2021), we record what we found that day as well as a survey that was conducted by Francois Becker who was doing his MSc on these toadlets at the time (see also Becker et al., 2018). The results present a startling view of exactly how local these toadlets are found around their breeding site: all within ~200 m. This is very surprising and provides some insight into their enigmatic decline (see Cressey et al 2015). 

In addition to invaluable life-history information on this IUCN Critically Endangered species, we explain the importance of making natural history observations following extreme events. 

Read the full article here:

Measey, J., Becker, F. & Tolley, K.A. (2021) After the fire: assessing the microhabitat of Capensibufo rosei (Hewitt, 1926). Herpetology Notes14: 169-175. pdf

  Frogs  Lab

Transparency from your proposal onwards

22 January 2021

Starting out transparent

The scientific method requires us to pose a falsifiable hypothesis, design a controlled, rigorous and repeatable methodology, and report and interpret our results honestly. In theory, it’s all pretty straight forward. I’d like to think that in a world where science is adequately funded, we’d have already reached a situation where transparency was endemic in the scientific system. However, science has not been so lucky, and where there are shortcuts, some people will take them in order to get ahead of others. One of the objectives of this blog is to demystify what happens in biological sciences. In other words, the demystification in this blog is only really needed because so much of what happens does so behind closed doors, and out of the gaze of less privileged scientists. As you read through this blog, you will see countless examples of where things are not as they should be. I have always tried to insert solutions when I highlight problems, but these are admittedly piecemeal, rarely proven, and even in a best case scenario might be best thought of as temporary solutions. The logical antidote to all these shady scientific dealings is to turn to transparency.

We would do better moving to open and transparent science. The open science movement is gaining traction (Sullivan et al 2019), and I hope that it will become the norm in the very near future. Those of you who are reading this now are likely to be students during an interim period prior to open science becoming mainstream. Therefore, you will be instrumental in adopting this process as soon as possible to ensure that science becomes a fairer place for scientists from all backgrounds, and with all results. 

I try to consistently encourage you toward transparent and open practices in science. Here my aim is to introduce this topic and provide an overview of the main areas in which you can currently make a difference by opening up your research. As the Centre for Open Science explains (COS: see here), this will take a shift in the culture of the scientific community, which is why you need to understand and adopt a transparent approach from the outset of your research career. There are much better and more comprehensive guides and online resources so I encourage you to look through the literature cited here. Although I advocate hard for the COS, please be aware that this is not the only set of guidelines 


Preregistration

You will spend a considerable amount of time at the beginning of your PhD studies planning what you want to do. In many institutions, this will take the form of a formal proposal. It will be agreed with your advisor, and may well pass the inspection of a committee. You will put a lot of effort into reading the literature in order to ask the best hypotheses possible. You will design your experiments with rigor and control, and potentially redesign them after your advisor and committee comment. The effort put into your proposal is totally disproportionate if it’s never looked at again. Yet, this document is of historical importance, because it says what you think before ever doing the experiment and collecting or analysing the data. Thus, it can in future prove that you were not conforming to confirmation bias, for example by HARKing: rewriting your hypothesis after getting your results in order to get a significant result (Kerr 1998; Forstmeier et al 2017). 

Confirmation bias is a problem in science because of the way that science is published (see part 4). In brief, articles for journals with higher impact are regularly selected based on significant results. If you don’t have that significance, they are unlikely to want to take your manuscript. For this reason, many scientists have sought to have significant results to report, and this is called confirmation bias. Confirmation bias is bad because it violates the assumption that we are answering the hypothesis that we started with, or it could cause scientists to manipulate their data until a significant result is achieved. For example another form of confirmation bias isphacking: repeating tests with different approaches in order to a significant result. Rubin (2020) gives a good list and set of explanations. As there are a lot of known ways in which researchers have been thought to deliberately or accidentally report false-positive findings, one solution can be archiving your intentions, referred to as preregistration (Forstmeier et al 2017). If you register your proposal (or any research plan), you can present this historical document to a journal (probably 4 to 5 years later) to show that you have done what you planned to do. 

What have you got to lose? With a good proposal that you feel confident with, you have nothing to lose. By registering your proposal, you are most likely to gain, especially in the future if more journals require preregistered hypotheses and methods in order to submit to them. What this does mean is that you will need to do a good job of your proposal. This can be daunting when starting a new PhD, especially with respect to the analyses if you are not from a strong analytical background. Your proposal period should be time to make sure that your knowledge of analyses that you will do is sufficient. I would suggest that the best way to make sure that you are proficient is to obtain a working knowledge of how to handle a dataset such as the one you are going to generate in your experiment during your proposal period. If your lab already has similar datasets, borrow one. If not, generate some data that you can use. 

What if new analyses appear during the period, or you are forced to change your experimental protocol. Certainly, most analytical software will be updated over the course of your studies, and some might be superseded. None of this is a real problem to your preregistered content. Logging the software that you intend to use will demonstrate the approach and type of analyses that you intend to take. While it is unlikely that you will ever be held to account for minor changes to equipment or protocol, things do change along the way. It doesn’t mean that you won’t be able to report your results, or that your research won’t be viable. But it does mean that you will need to be transparent about why it changed. For this reason, it is a good idea to document the changes to your proposed research plan and why they happened. It is surprisingly easy to forget! There are some great tools on different platforms for adding this information, together with a timestamp so that it’s clear when it was done. 

Will preregistration of research eliminate the bias from science? It is probably too early to tell (Rubin 2020), but it is certainly a good place to start (Nosek et al 2018). The more researchers know and subscribe to transparency in their research, the more it will shift the culture in science for the better (Forstmeier et al 2017).

What Platform to use?

When choosing where to archive your proposal (or any of your data, analyses, etc.) there are lots of platforms to choose from:Bitbucket,Figshare,Github,OSF,Zenodoand the list will undoubtedly grow. Making a decision about what you are going to use now may not require that you stick with this same platform for you entire career, but there are some things that you should consider:

Here are some of the considerations that you should take on board:

  • What do people in your lab and institution use? It’ll be easier to use the same platform as your advisor and other lab members
  • Some platforms require a subscription, check whether your institution is a member.
  • Avoid using any platform that is tied to a publisher. 
    • Although it’s not possible to future proof this (as publishers have been shown to buy up anything they think will help them control the academic market), you can check how the platform is set up and opt for those that are non-profit organisations. 
    • Other important aspects are “open source”, free to use and access. 
  • Can the platform function for more than one aspect of transparency?
    • As the need for transparency in science grows, it will become important to have more aspects of projects archived. Does the platform that you’ve chosen cover all the stages from conception to publication?
  • Is it easy to use?
    • Some of the platforms will be more intuitive to use, while others require a steep learning curve. Consider how friendly they may be to other collaborators, older advisors, etc.
  • Are the archives easily compatible with other platforms?
    • Working across platforms might be important for your project, especially if you start with collaborators that are already using different platforms. 

The platform you choose should work for you (rather than having you work for it). If you are someone who loves to have everything ordered and organised, then you’ll love seeing this all laid out. If you aren’t, then these platforms are going to be a massive help to getting all of your plans sorted. Make updating your platform a habit. For example, you could make sure that notes taken during meetings with your advisor on different projects are logged onto the platform. This way you both have a record of what decision was made when. Remember that you can choose what you make accessible to the outside world. 


Transparency as you move forwards

There are a whole lot more transparency criteria that you will need to be aware of later on in your PhD when it comes to publishing. You will come across these in part 4 of this blog. Becoming familiar with the entire process now will be to your advantage, so I encourage you to read more about this project. Sullivan et al (2019) provide a nice overview about how to get started, but be sure to consult documentation at OSF.


References

Forstmeier, W., Wagenmakers, E.J. and Parker, T.H., 2017. Detecting and avoiding likely false‐positive findings–a practical guide.Biological Reviews, 92(4), 1941-1968.

Kerr, N. L. (1998). HARKing: Hypothesizing after the results are known. Personality and Social Psychology Review, 2, 196-217. http://dx.doi.org/10.1207/s15327957pspr0203_4

Nosek, B.A., Ebersole, C.R., DeHaven, A.C. and Mellor, D.T., 2018. The preregistration revolution. Proceedings of the National Academy of Sciences, 115(11), pp.2600-2606.

Rubin, M. (2020). Does preregistration improve the credibility of research findings?The Quantitative Methods in Psychology, 16(4), 376–390. https://doi.org/10.20982/tqmp.16.4.p376

Sullivan, I., DeHaven, A. and Mellor, D., 2019. Open and reproducible research on open science framework. Current Protocols Essential Laboratory Techniques, 18(1), p.e32.

  Lab  Writing
Creative Commons Licence
The MeaseyLab Blog is licensed under a Creative Commons Attribution 3.0 Unported License.